As we know Amazon is one of the preferred channels to drive sales for retailers, it’s important for retailers to understand in detail, how the users are behaving on their Amazon store and how can convert these shoppers, that’s when Amazon Pi comes into the picture.
So What is Amazon Pi?
Amazon Pi is an Amazon analytics platform for brands selling products on Amazon with deep insights on different aspects including customer search terms, search ranking, share of voice, brand recall, sales by geography, search analytics and alternate purchases.
With the help of Amazon Pi insights, sellers can leverage data for Amazon organic and Amazon ads, and define a robust strategy to drive more sales on Amazon store with lower ACOS.
This guide will help you to understand each and every reporting aspect of Amazon Pi. So let’s get started!
How to access Amazon Pi Analytics?
What are the Different Reports Available in Amazon Pi?
Different reports available in Amazon includes
-
Awareness
- Search Performance
- Product Search Ranking
- Display Advertising Share of Voice
-
Consideration
- Product View (Glance View) Report
- Alternate Purchase
-
Purchase
- Sales By Geography
- Market Basket
- Price Distribution
-
Loyalty
- Customer Reviews and Ratings
Let’s understand each report in detail:
1. Awareness report in Amazon Pi
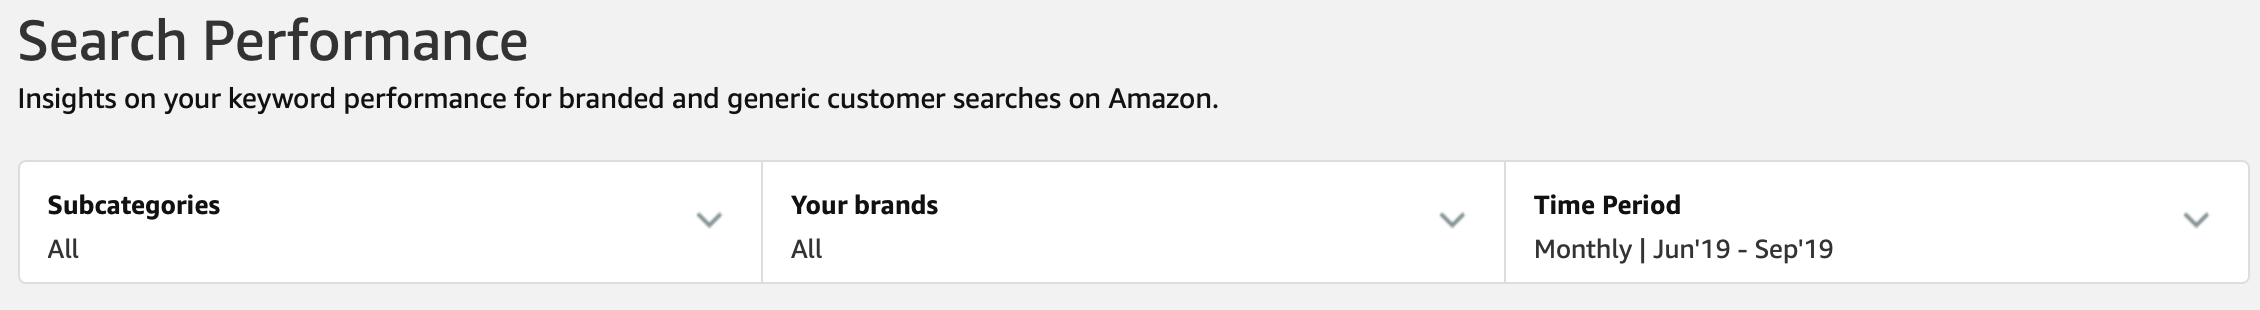
a. Search Performance
The Search Performance report helps you to understand how your Brand is performing on Amazon Search. The Search Performance report can be used to identify top ranked keywords for your products, and then target these keywords in your Amazon ad campaigns to improve discoverability of your products on top searched keywords.
Once you click on search performance report option on Amazon pi, you will first come across below screen. You can filter the report by subcategories or brand and then by time period for which you want to view the report for.
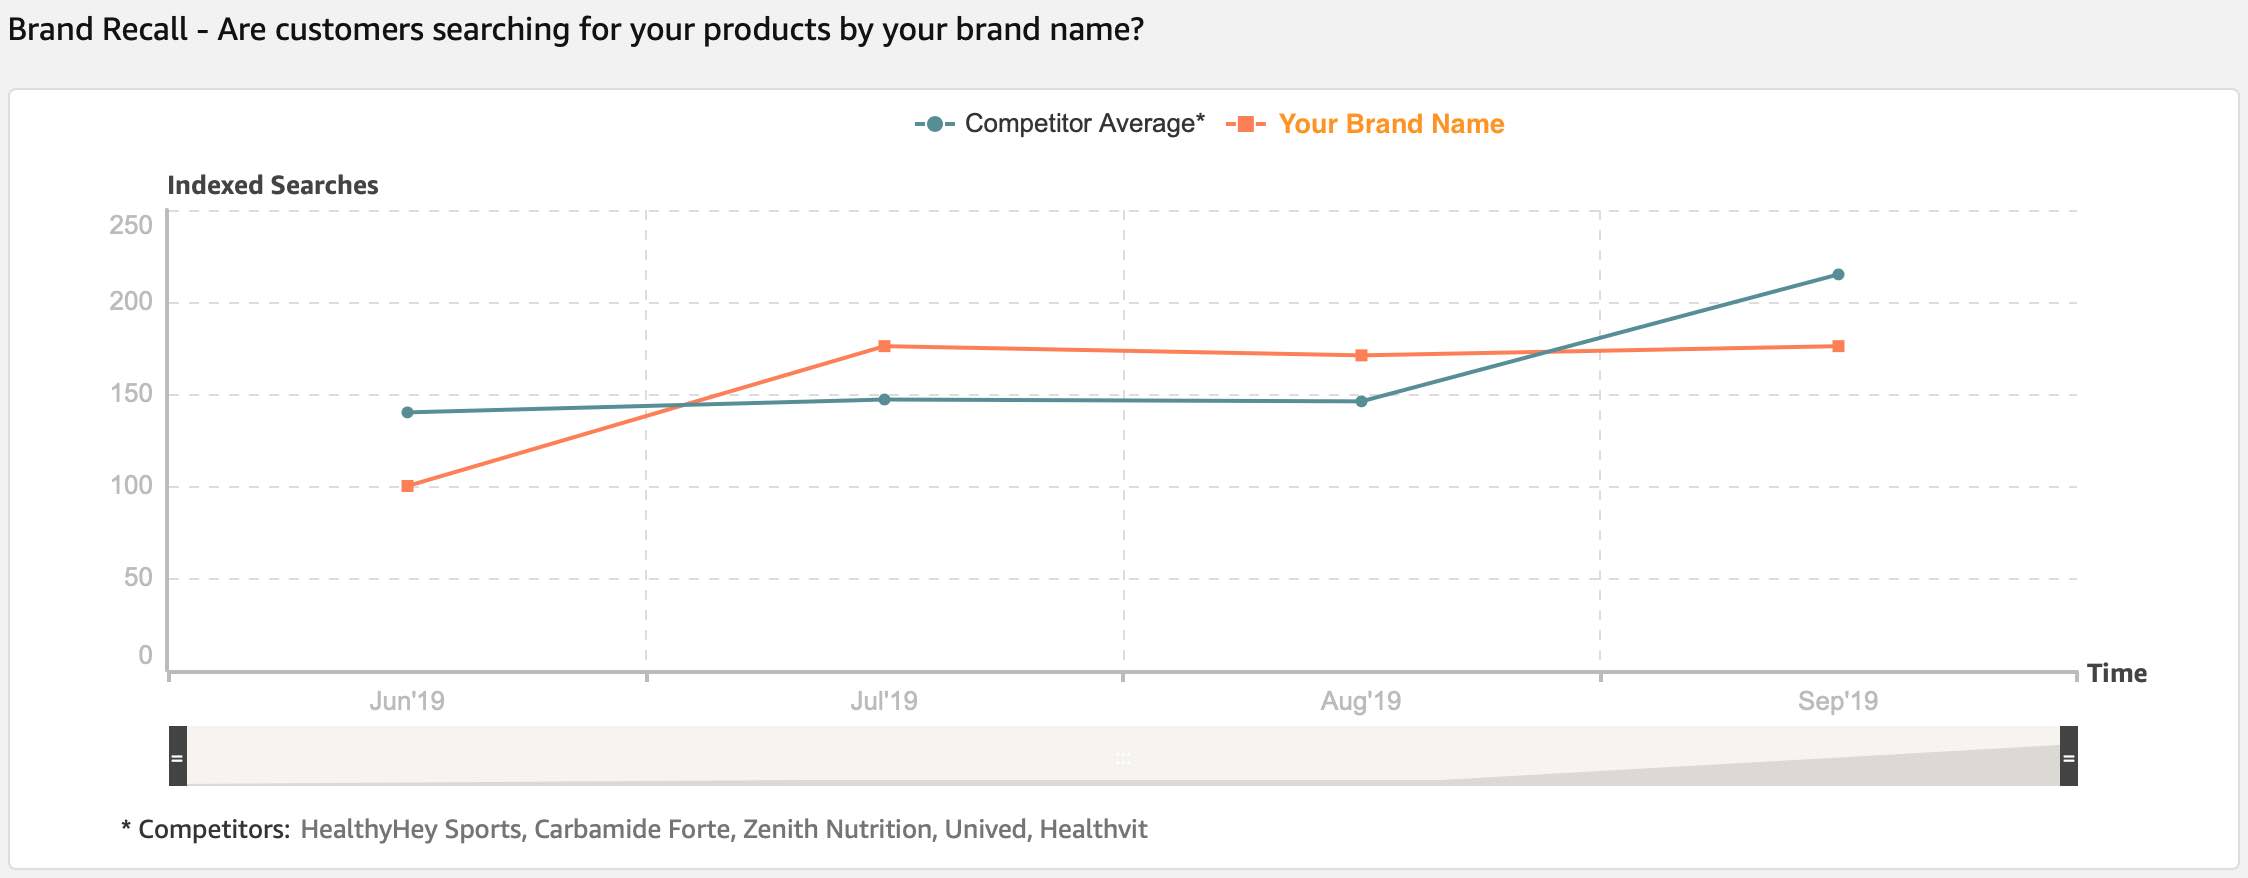
You can then see brand recall as the first section under search performance. Brand recall section helps you to understand if the brand search are increases or decreases for your brand on Amazon.
In the below screen, you can see that my brand searches are constant for 3 months. If you brand searches are decreasing, you need to start with sponsored ads to increase visibility.
The next section under search performance is Search Coverage.
What is Search Coverage?
It shows, how much presence do you have on the first page of search results (including Sponsored Products).
(Note: I have explained below in download report options, about how to read search coverage report and drive more value for your business on Amazon)

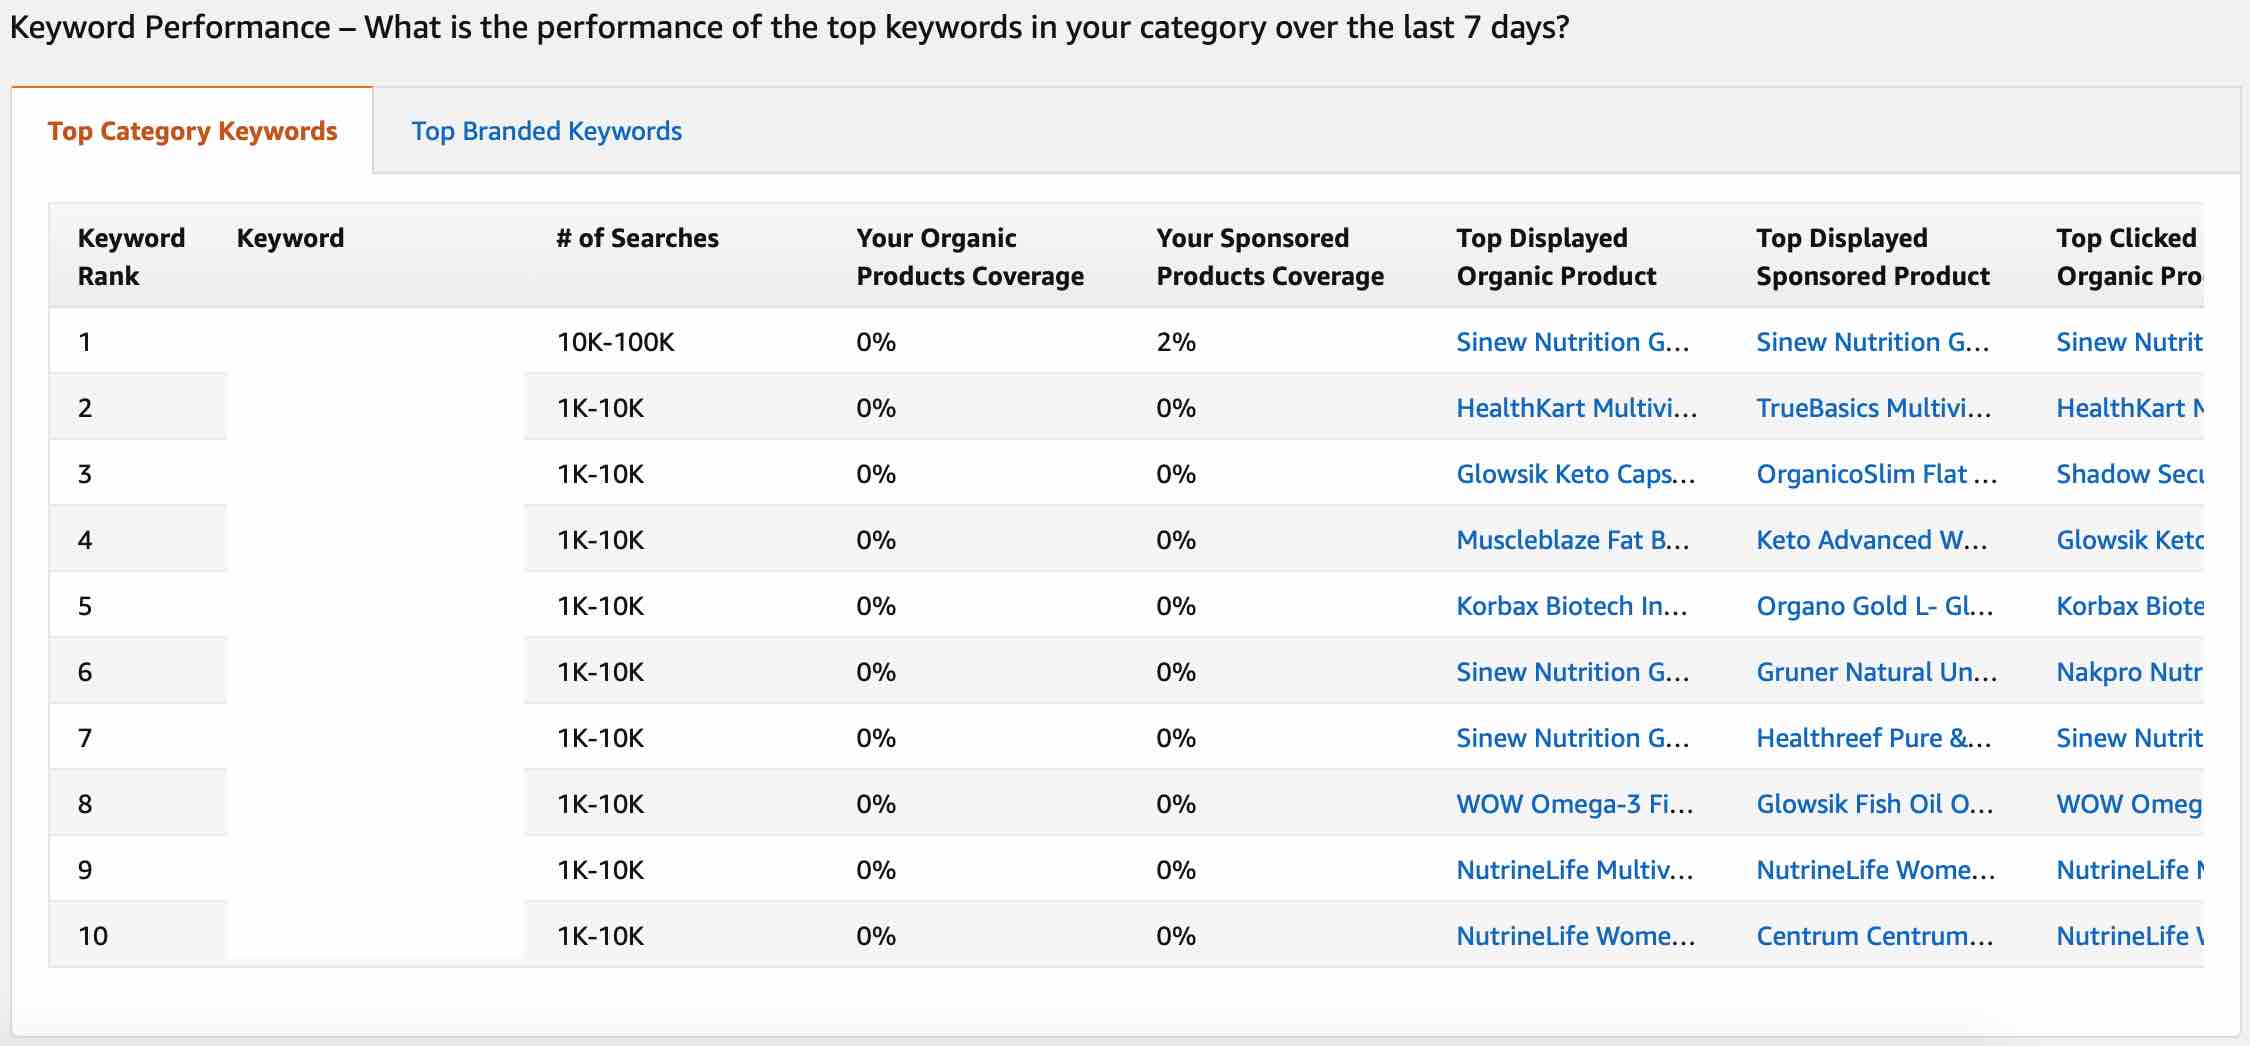
The next section is keyword performance. Keyword performance report helps you to understand the performance of the top keywords in your category over the last 7 days.
You can then download the report to understand in detail about search performance. Once you download the search performance report, you can view the following columns in the report:
- Keyword
- Total Search Coverage
- Sponsored Search Coverage
- Organic Search Coverage
- Traffic
- Top Display Organic ASIN
- Top Displayed Organic ASIN Title
- Top Displayed Sponsored ASIN
- Top Displayed Sponsored ASIN Title
- Top Clicked Organic ASIN
- Top Clicked Organic ASIN Title
- Top Clicked Sponsored ASIN
- Top Clicked Sponsored ASIN Title
Let’s understand each one of them:
Keyword – This helps you to understand the keyword on which your products were displayed in the search result.
Total Search Coverage – Total search coverage is similar to impression share on a particular keyword. Total search coverage gives you an idea about the impression share which you have achieved for a particular keyword on Amazon search.
The total search coverage includes coverage of organic and sponsored search in the reporting column. The search coverage should be at least 70%. If the search coverage is less than 70% you need to improve your search ranking on Amazon
Sponsored Search Coverage – Sponsored search coverage is the impression share for your paid campaigns on Amazon search. If you have recently started your Amazon ads, you need to increase your sponsored search coverage by focusing on the intent based keywords with the right match types and bidding strategy, which will help you to rank higher leading to higher sponsored search coverage.
Organic Search Coverage – Organic search coverage is the impression share for your organic results on Amazon search. In order to increase organic search coverage, Amazon considers couple of parameters which includes your search ranking, A+ content, conversion rates, purchase likelihood and CTR’s.
If you don’t want to spend more on Amazon, you need to improve your organic search coverage which will lead to higher sales on Amazon and lower ACOS from sponsored campaigns.
Traffic – Traffic column gives you an idea about the search volume of a particular keyword in the report. Once you download the report, you will see the search volume in range eg: 1k – 10k. So it’s difficult to actually understand the search volume of a particular keyword right now from this report, hopefully Amazon in further will help us with the exact search volume of a keyword.
Top Displayed Organic ASIN – Top displayed organic ASIN will help you with the ASIN number which was displayed for a particular keyword. This ASIN can be your competitors product, you can do an analysis of this product detail page and study why this page is ranking on Amazon organic search.
Top Displayed Organic ASIN Title – Top displayed organic ASIN title column report will help you understand the top displayed organic product ASIN title for a particular keyword. By studying these product titles, you can see how the keywords are defined to these product pages and then optimise your product titles.
Top Displayed Sponsored ASIN – Top displayed sponsored ASIN will help you to understand the ASIN number of the product which was displayed as sponsored results for a particular keyword. You can again study the product page of this ASIN and optimise your content, as this page is ranking on sponsored search results.
Top Displayed Sponsored ASIN Title – Top displayed sponsored ASIN title column report will help you to understand the title of the product which displayed in top sponsored search result of Amazon for a particular keyword. View all these Titles and study the way they are defined on product pages.
Top Clicked Organic ASIN – Top clicked organic ASIN column report will give you the exact ASIN which got clicked on organic for a particular keyword. After understanding the product, go to the product page and study the title and content of the page.
Top Clicked Organic ASIN Title – Top clicked organic ASIN title column report will help you to understand the title of ASIN which got the click for a particular keyword. This is an important column to look, you can study the title of the product page with respect to the keywords added in the title and any other attributes of the product added in the title.
Once you have studied the titles, now go ahead and optimise your ASIN titles.
Top Clicked Sponsored ASIN – Top clicked sponsored ASIN column report will help you to understand the top clicked product in the sponsored search results, for a particular keyword. Study the title and content of the page to understand in detail as it’s ranking high.
Top Clicked Sponsored ASIN Title – Top clicked sponsored ASIN title column report helps to understand the top clicked sponsored product’s title, for a particular keyword. Study the title and optimise your sponsored product page title.
b.Product Search Ranking
Once you click on product search ranking option, you will come across below screen.
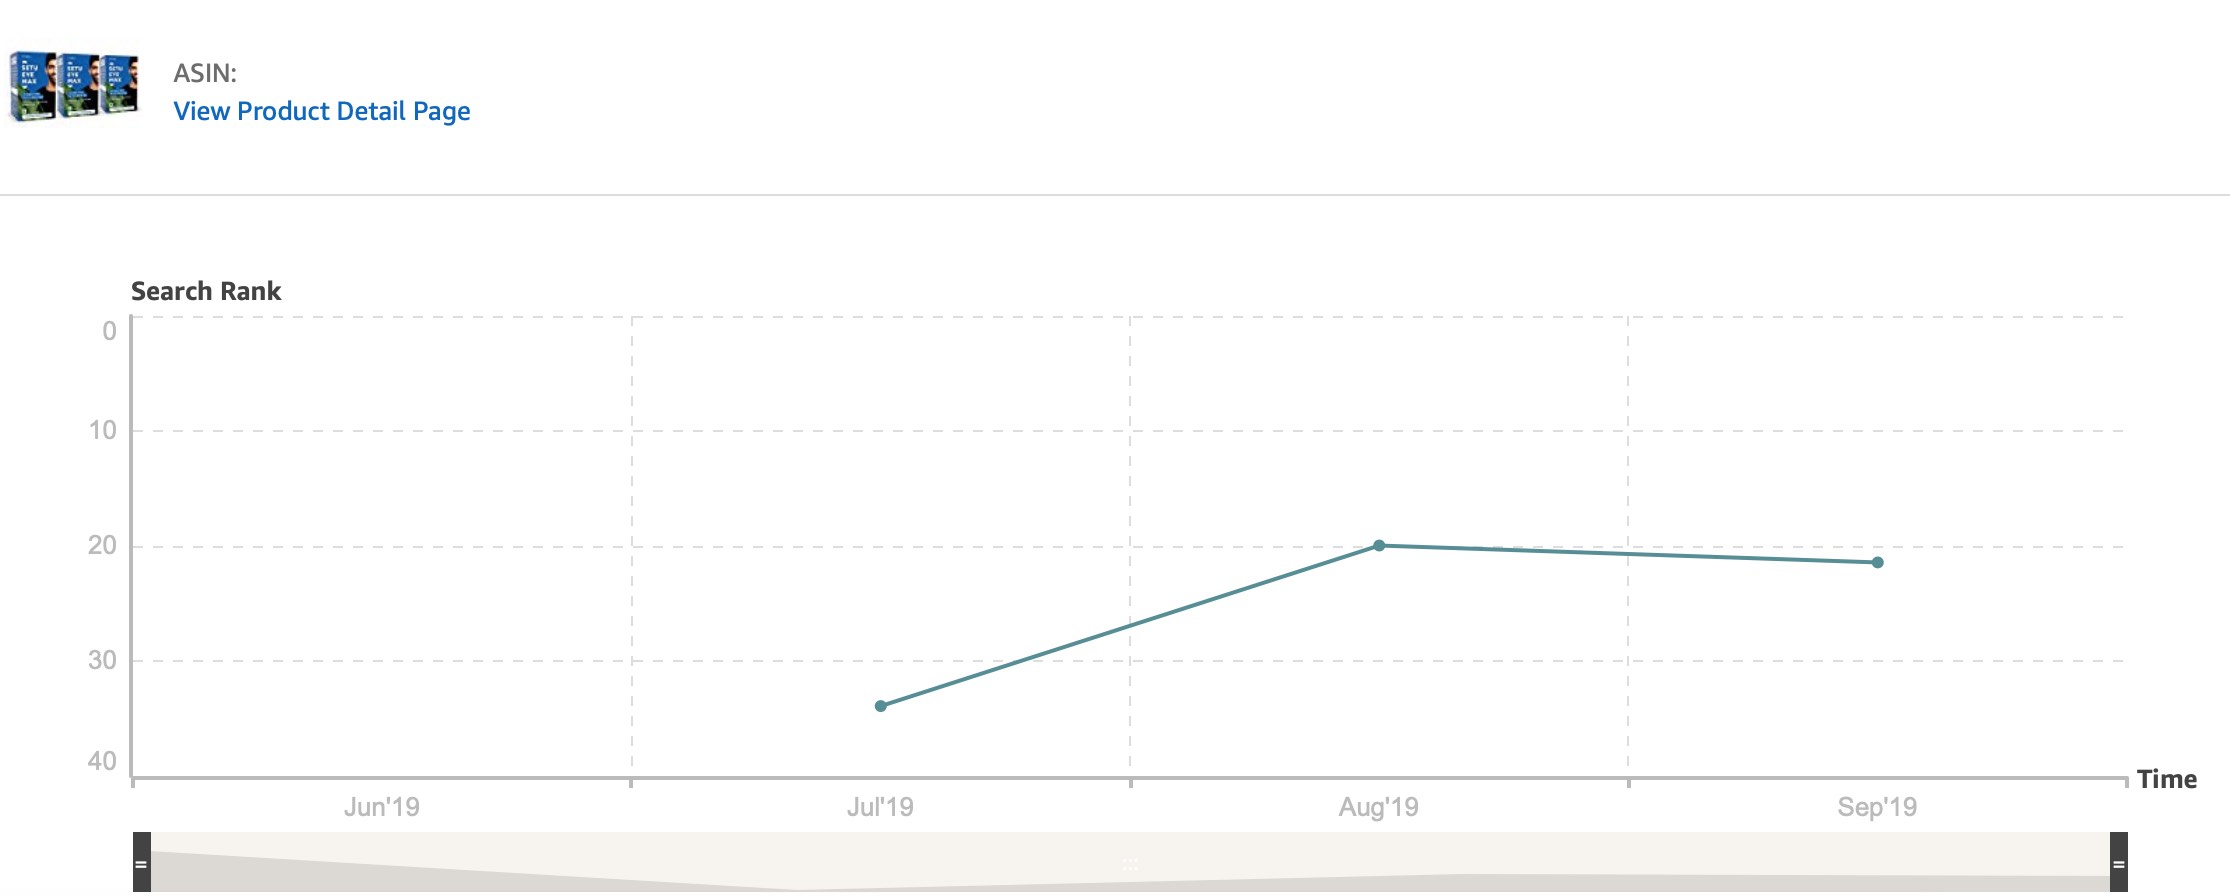
What is Product Search Ranking in Amazon Pi?
Product search ranking is the average ranking/position of your products in Amazon search results for relevant keywords.
Product search ranking report considers all the keywords where your products were shown in the first 200 search results (each search result page has 20 results), considering all the relevant keywords for this product.
Note: This is a product search rank and not keyword ranking
How does Amazon calculates product search rank?
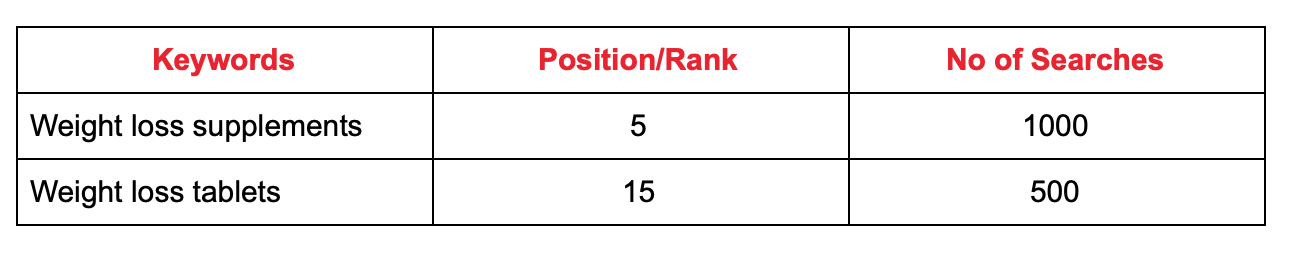
Product search rank is calculated by the total number of searches happened for different keywords (related to a specific product).
For Eg: If you product was shown for 2 keywords as shown below then your product search rank will be (5X1000)+(15×500)/1500 = 8.3
Amazon calculates the product search ranking basis the number of times your product has been searched, so you actually don’t need to check where you are ranking for each keyword on Amazon.
How to improve product search ranking on Amazon?
In order to improve search ranking on Amazon, look at the below aspects and start optimising
Product Page Titles – Define the Title with the keyword and additional information about the product including feature, type, number of items, ingredients etc, depending on the type of product you are marketing.
Product Page Description – Define the description of your product in detail with the keywords associated with it product page. The description should also highlight the features/benefits of the product.
Value Proposition – The product page should highlight the value proposition of the product which entices the shoppers to consider your product.
Trust Factors – Add trust factors, which states that the products are approved by leading bodies in the space. You can also add any certificates received for the product/brand which then builds credibility.
Reviews – Define a review strategy for your by encouraging your customers to review your product on Amazon
Advertising – Use Amazon ads if you are new on Amazon because this will push your ranking higher in search results.
Once you download the product search ranking report, you will be able to see the below option:
- ASIN – Is the ASIN of your product for which the ranking is defined in the report
- Item Name – Item name is the name of the product
- Brand Name – Brand name is the name of your brand on Amazon
- Category – Category is the category name in which you have listed your product on Amazon
- Sub-Category – Sub-category is the sub-category name in which you have listed your product on Amazon store
- Search Month – It is the month for which the ranking is defined. The ranking in the report is month on month
- Search Year – Search year is the year for which the ranking is defined
- Search Rank – Search rank is the average rank for the ASIN, which is the product on your Amazon store
c. Display Advertising Share of Voice
What is Display Advertising Share of Voice?
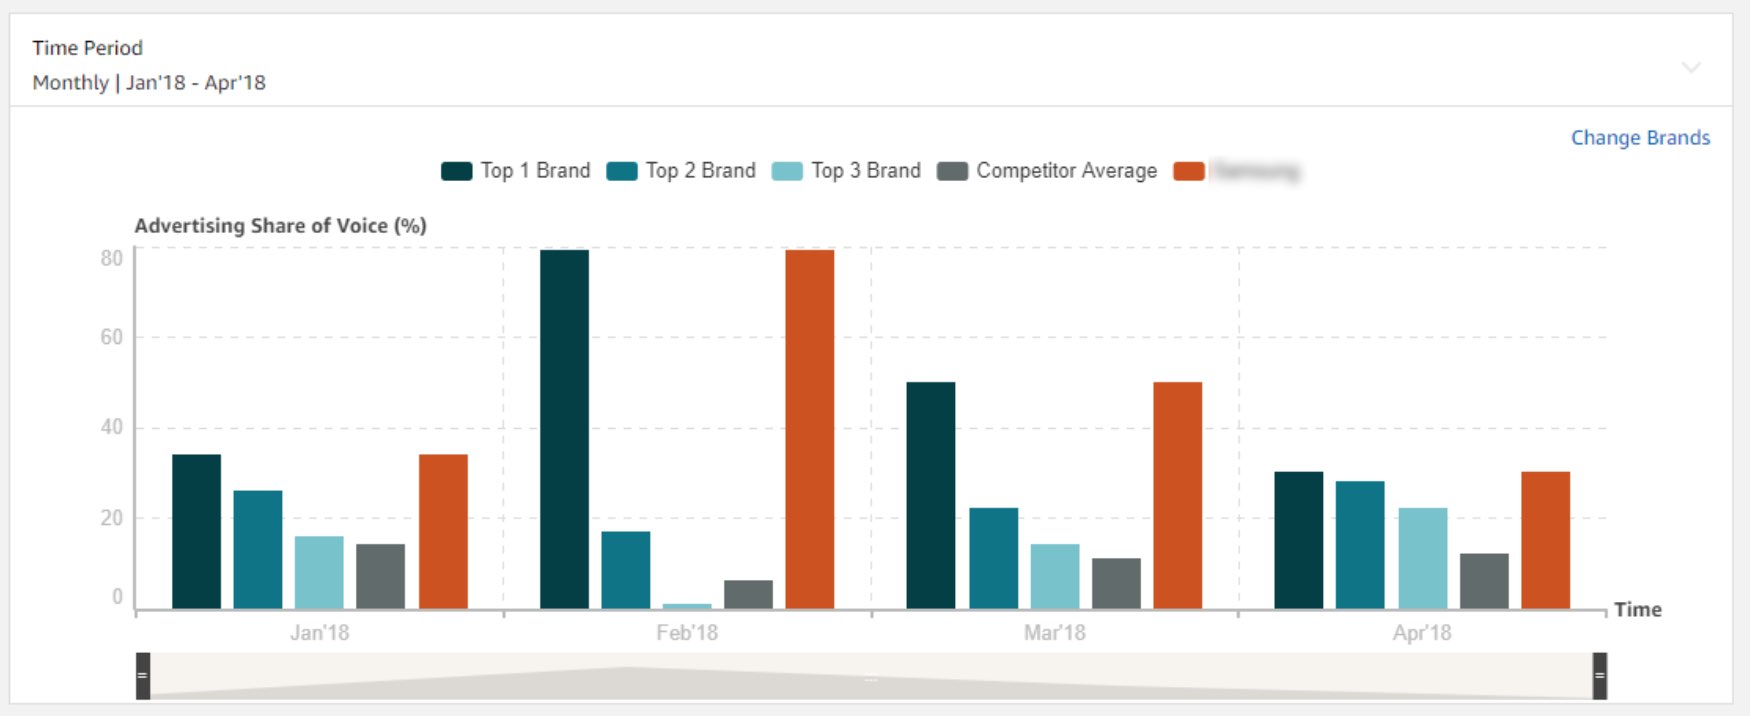
Display advertising share of voice report gives your display share of impressions in comparison with other brands in the same category.
Display advertising works on a CPM model. In order to run display ads, you need to talk to Amazon team, as you can only run product display ads from Amazon marketing services self-serve platform.
With the help of this report, you will be able to understand, how much share you are achieving with respect to your competitors, which then helps you to plan your spends better.
2. Consideration
a. Product View (Glance View) Report
What is Product View (Glance View) Report in Amazon Pi?
Product view or glance view are views on your product page.
How does Amazon calculates product views (glance views)?
Amazon calculates product views basis the product views on your product page, and then divide/multiple all numbers with a dynamic constant.
For Eg: If your product page was viewed 5000 times and the constant used is 10, then the indexed views will be 500.
Amazon uses this method to simplify interpreting these reports, so that you get the trends of product views than actual views.
In the below screenshot, you can see three competitor brands are compared with respect to your brand, which helps you to understand your product views vs competitor product page views. While generating the report, Amazon uses the same constant from all the three competitors.
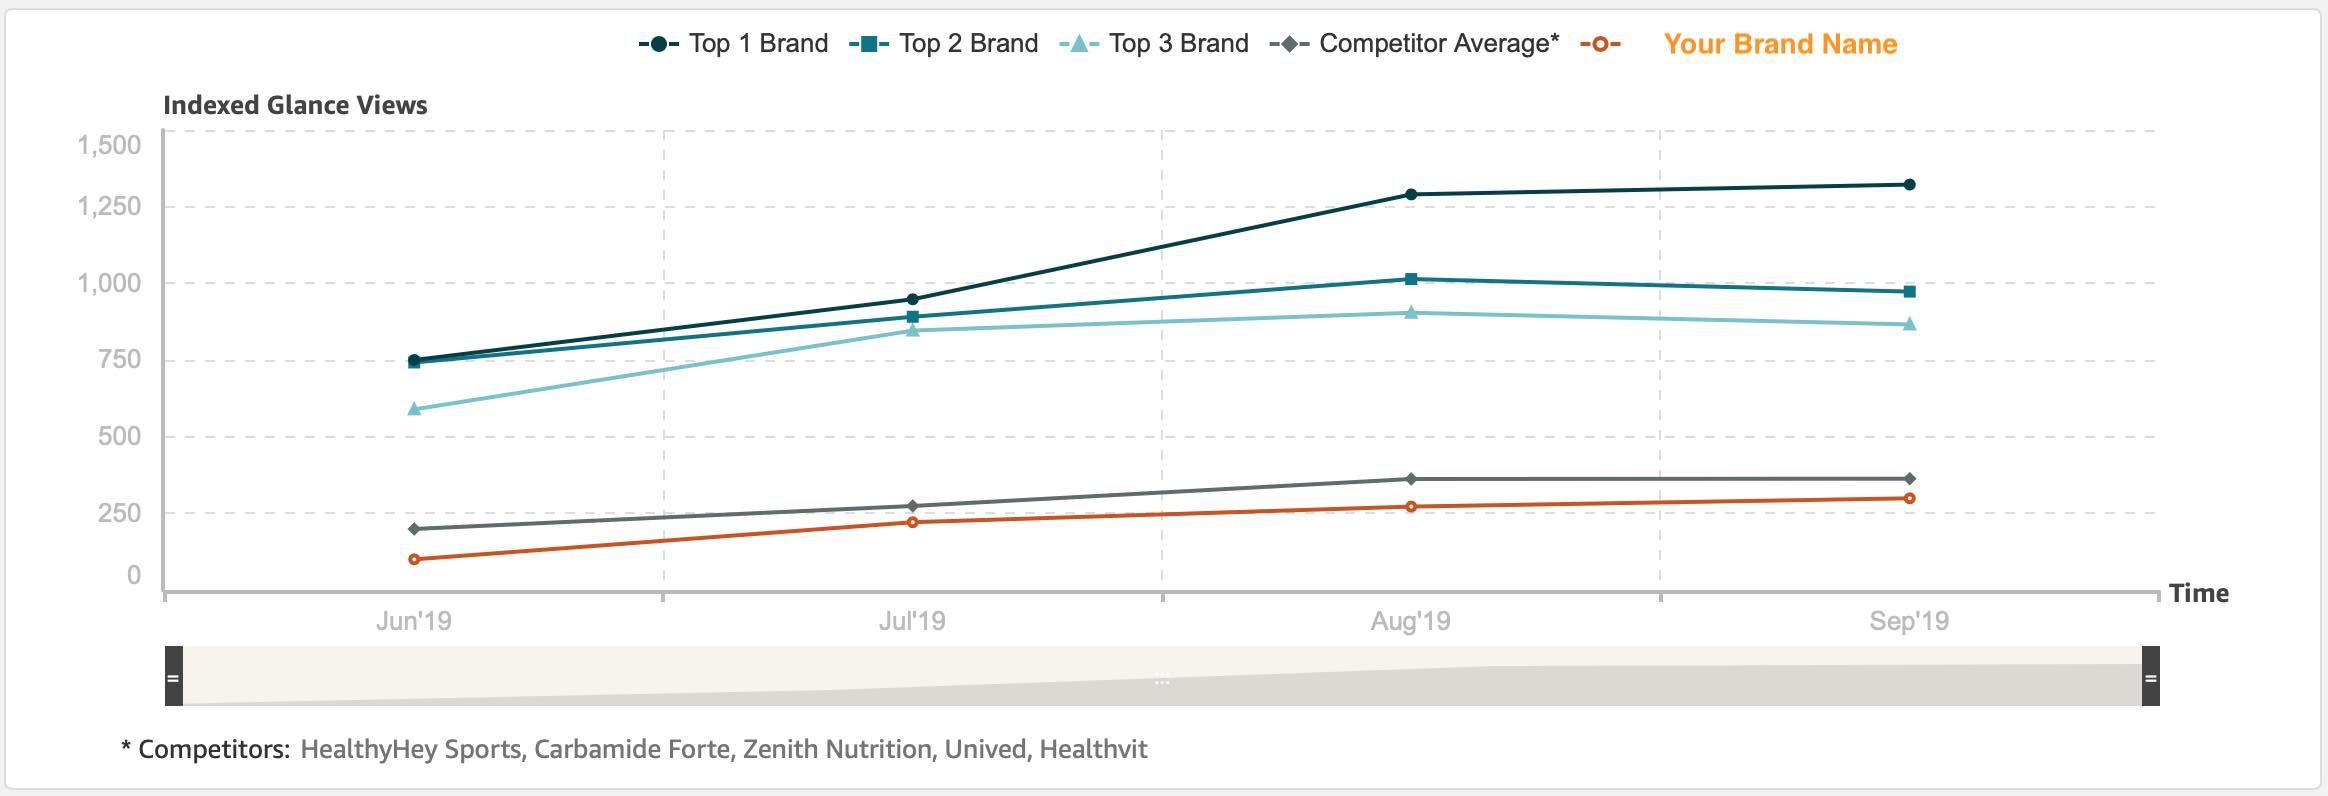
If the product views are higher compared to competitors, it means shoppers are considering your product, but that does not guarantee a sale. You can further compare this report with the sales report so that you understand the conversation rates from product page view to sale.
If you are observing high product views and low conversions, you need to optimize your product pages effectively considering the below aspects:
Product Description – Describing the product in detail with the targeted keywords. Adding USP’s of the product, trust factors and reviews on the product page
Use discounts – Use discounts to drive sales by studying competitor discount strategy and pricing strategy.
If you are observing low product views on the product pages, you can then increase product views by considering following aspects.
- Advertise those category products with low product views
- Use third party sources to drive traffic to increase product views, eg: Run ads from Google ads or Facebook ads to Amazon product pages
Once you download the product view (glance view) report from Amazon pi, you will see below columns in the report:
- Brand Name
- Month Name
- Year
- ASIN
- Category
- Sub-category
- Glance Views
b. Alternate Purchase
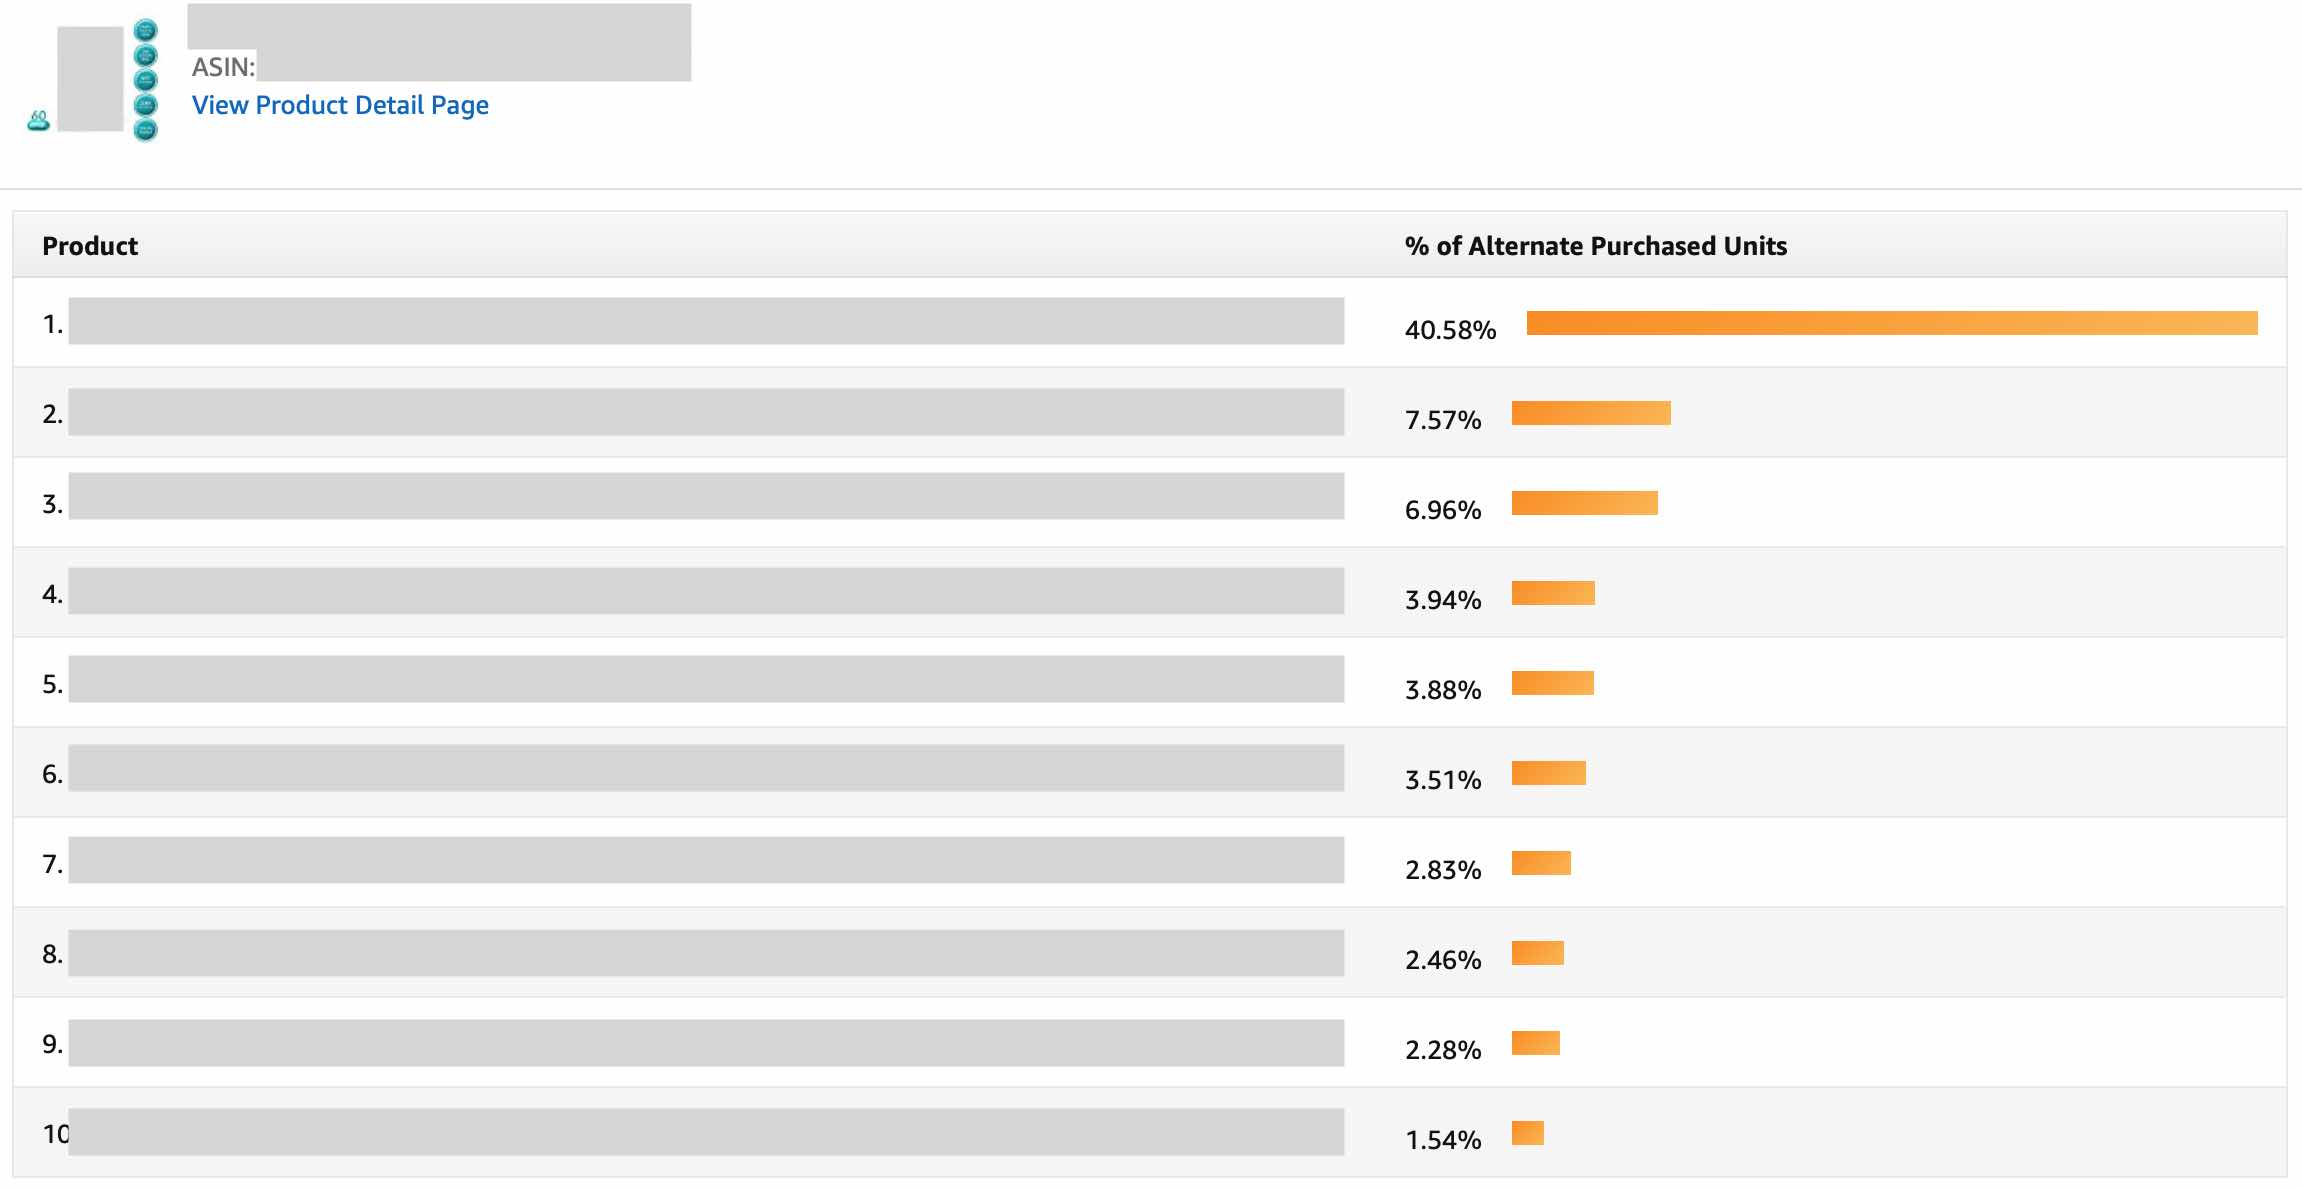
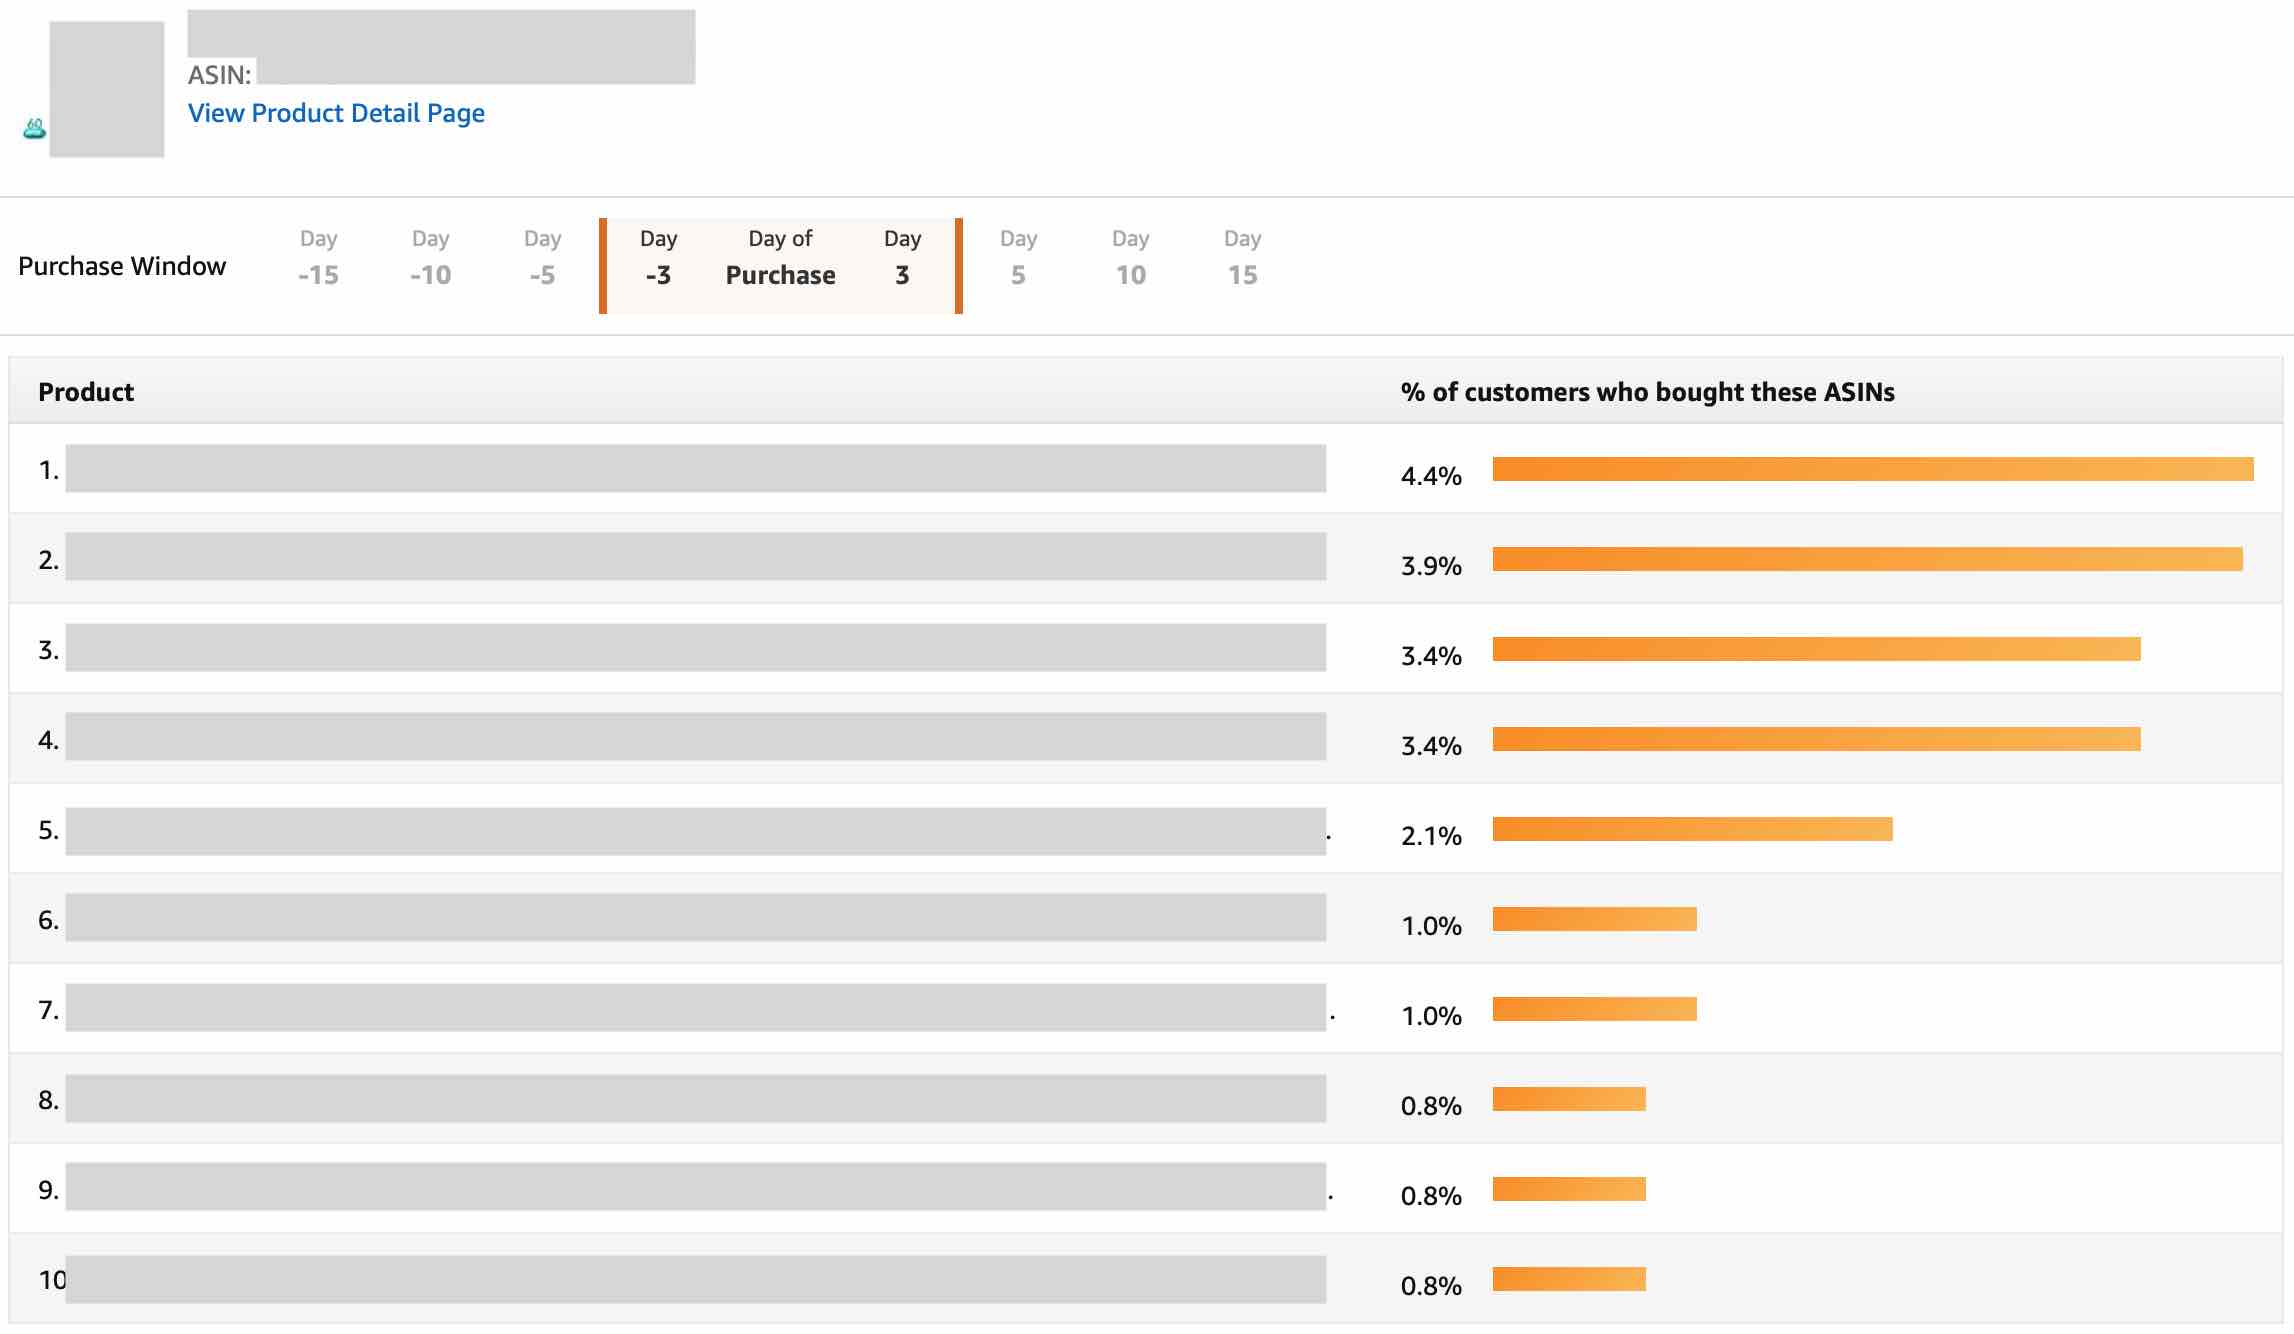
Alternate purchase report tell you which products customers bought after viewing your product page.
Eg: The customer viewed your product page of weight loss supplement and did not buy your product but bought xyz brand (other brands) weight loss tablet.
The report gives you a percentage of times a particular product was bought as an alternate product when your product page was viewed. Eg: If 1000 shoppers went to you weight loss supplement page and 200 shoppers bought xyz brand weight loss tablet, then the xyz brand is the alternate purchased product in 20% of the instances.
Once you download the report, below are the columns included in the report, the report is at an ASIN level:
- Viewed ASIN – Viewed ASIN is your product viewed by the customer
- Viewed ASIN Title – Viewed ASIN title is the title of your product detail page
- Viewed Month – Is the month for which you are viewing data
- Viewed Year – Is the year of the report
- Bought ASIN – Bought ASIN is the product which was bought after viewing your product, this is the important column to look at
- Bought ASIN Title – Bought ASIN title is the title of the ASIN which was bought
- Alternate Purchase Percentage – Alternate purchase percentage is the percentage of times the product was bought against your product
- Category – Category is the name of the category under which you have listed your ASIN
- Sub Category – It is the sub category under which you have listed your ASIN on Amazon
How to use Alternate Purchase Report?
You should look at the below aspects from alternate purchase report to optimise your performance
Target Competitor’s on Ads – If you observe that a specific competitor product is bought quite often, then you can advertise on their product by adding competitor’s brand terms in your campaign, adding their ASIN’s as keywords or promoting your product on the competitors product page through product display ad.
Pricing & Offers – Look at the pricing and offers defined by your competitor on their product page, which will also give you an idea if customers are buying because of offers/discounts. You can then define different offers and discounts and see which works for you.
Product Page Optimization – Go through the competitors product page in detail including ASIN titles, descriptions, value proposition, reviews, Q&A’s and reviews. See what keywords are targeting on the page and then optimise your product page content.
3. Purchase
a. Sales by Geography
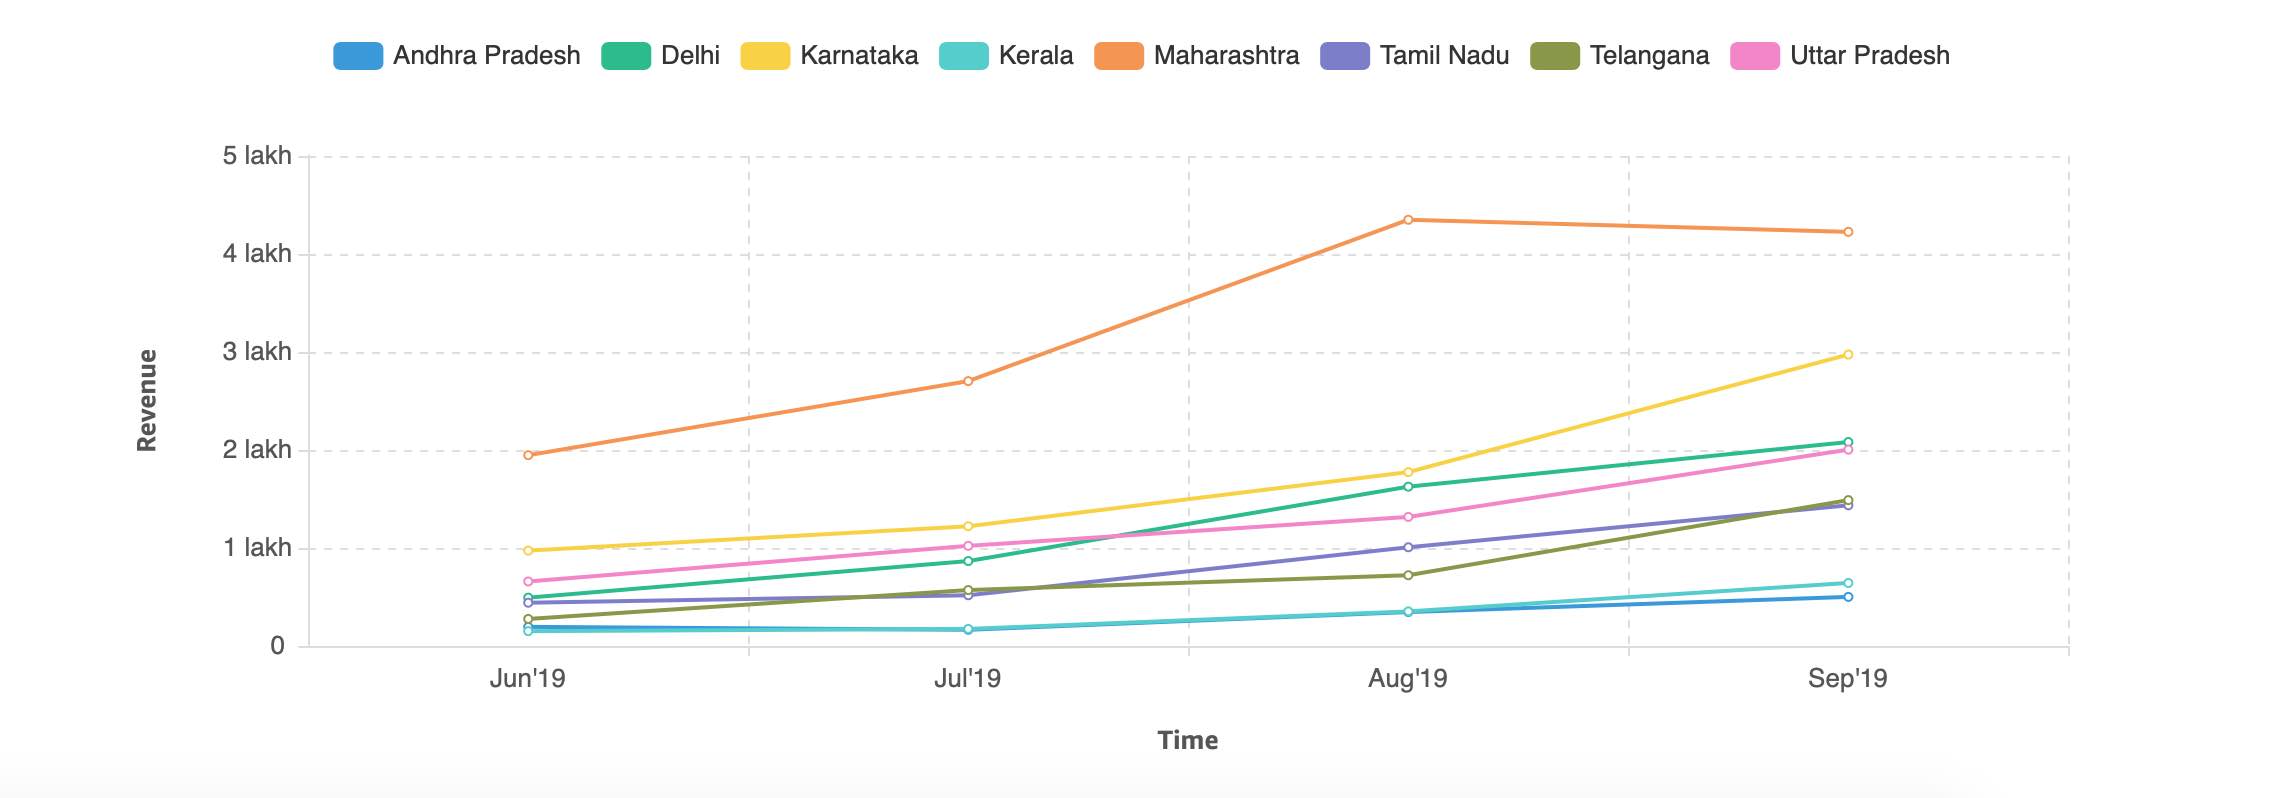
Sales by geography report provides revenue generated from each state for a particular product, with respect to pin code of each state. In the above screenshot you can see the states and the revenue month wise, the states are arranged in alphabetical order.
Once you download the report, below are columns which you see in the report
- ASIN – It’s the first column in the report, it gives you the ASIN for which the sales by geography report is generated
- Item Name – Item name is the name of your product
- Brand Name – Brand name is the name of your brand on Amazon store
- Order Month – It’s the month in which the orders have been placed
- Order Year – It’s the year in which the orders have been placed on Amazon store
- Order Amount – Order amount is the revenue generated from a particular ASIN
- Order Quantity – Is the number of units sold
- Category – Is the category of your product
- Sub category – It’s the sub category of your product
- State Name – State name is the name of the state, where the order was delivered
- Postal Code – It’s the pin code of the state, where the order was delivered
How to use Sales By Geography Report?
With the help of this report, you should consider below factors for improving your performance
Identify Emerging Geographies – If you see that new geographies are driving more sales on Amazon, you can start focusing on these geographies through other channels including Google Ads and Facebook Ads. Also you can define offline strategy in these markets.
Measure Conversion Rates – Measure the conversion rates of ASIN by combining glance view report and sales by geography report. If the conversion rates are low, consider improving the product page content and also define different discounting strategies.
Marketing Evaluation – Evaluate how your sales are improving basis the offline marketing strategies used in these geographies, measure it for the key performing products.
b. Market Basket
Market basket report helps you to understand which other products also customers bought when they bought your product.
Market basket report helps you to understand which other products also customers bought when they bought your product.
Once you download the report, you will see the below columns in the report
- Bought ASIN – Bought ASIN is the ASIN of your product which is bought by the customer
- Bought ASIN Title – It is the ASIN title of your product page bought by the customer
- Brand Name – It’s the name of your brand
- Category – It’s the category listed by you on Amazon store
- Sub Category – It’s the sub category listed by you on Amazon store
- Bought Month – It’s the month in which the product was bought
- Bought Year – It’s the year in which the product was bought
- Bought ASIN – It’s the other product which the customer has bought along with your product
- Bought ASIN Title – It’s the ASIN product page title of the other product bought by the customer with your product
- Bought Percentage – It’s the percentage of times, the other product was bought by the customer along with your’s
How to use Market Basket Report?
With the help of market basket report, you can consider following aspects for your marketing strategy on Amazon
Advertise on ASIN’s Bought Maximum Times – Identify which products are bought maximum times when your product is bought and then start advertising on competitor product (if it’s relevant in the space of your business) by using competition keywords, competition ASIN’s and targeting product display ads on competition product pages.
c. Price Distribution
Price distribution report helps you to understand the distribution of sales at different price points category, competition and your brand.
For Eg: in the below screenshot you can see that maximum sales for my brand has happened when the price point of my product is between Rs. 1000 to 1400 and the competition sales are higher when the price points are between Rs. 200 to 600
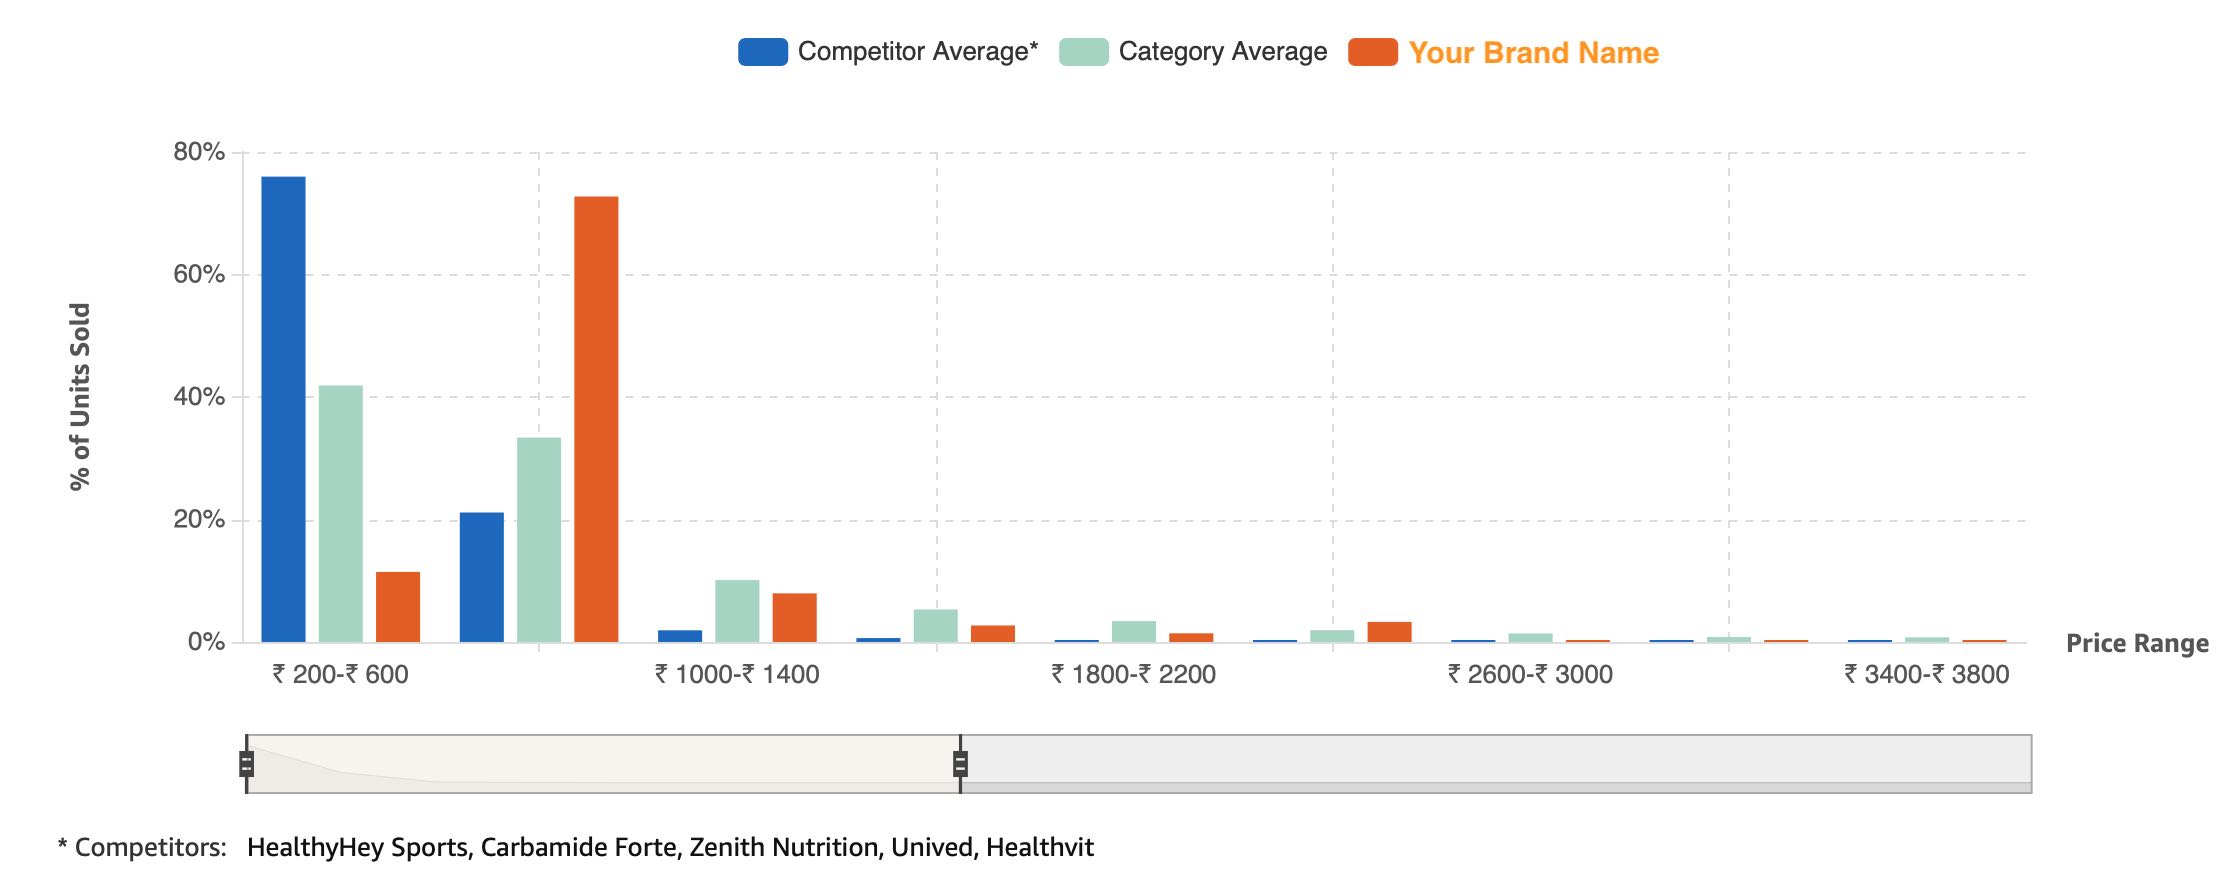
This shows that low price points are driving sales for competition vs your brand. Price point of the product is defined basis the margin the brand wants to mark on the product and also basis the competition price point. If your price is very high compared to your competitors, you need to relook at the price point for your product.
4. Loyalty
a. Customer Reviews & Ratings
Customer reviews & ratings report gives you the trends of the average customer ratings & the number of reviews for your products vs other brands for a specific category or sub category.
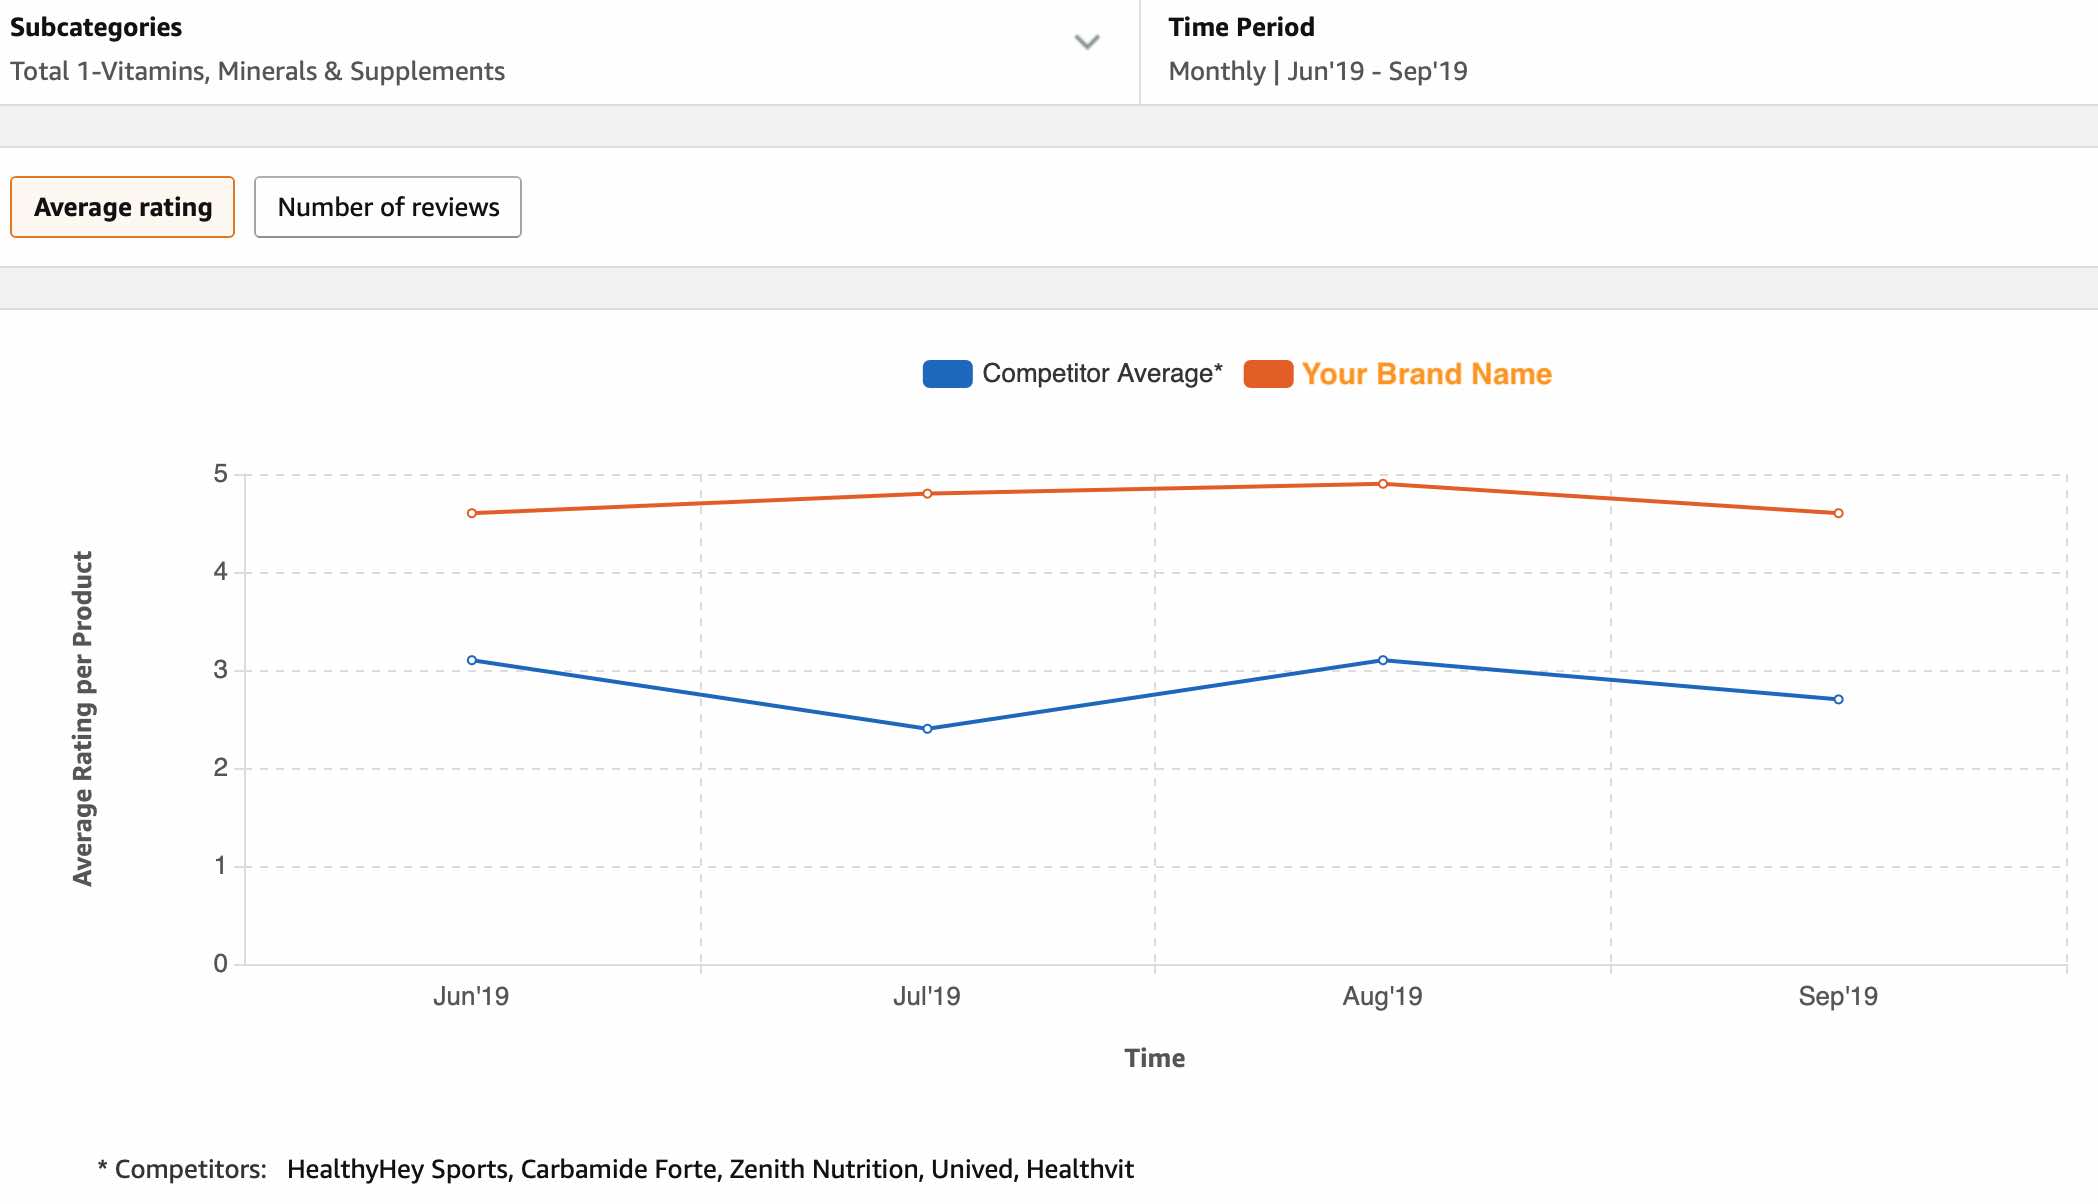
In the above screenshot, you can see the monthly average rating for a specific sub-category (which you can select on the above top left) of your brand Vs competition brand.
You can download the report and view the average monthly ratings & number of reviews received for all your ASIN’s on Amazon.
Once you download the report, you can view the below columns in the report.
- Brand Name – It is the your brand name
- Month Name – It is the month for which you have received the ratings & reviews
- Submission Year – It’s the year in which the ratings & reviews were submitted on Amazon
- ASIN – It’s the product for which you have received the rating
- Item Name – It’s the name of your product
- Average Rating – It’s the average rating received for your ASIN
- Total Reviews – It’s the total no of reviews received for your ASIN
- Category – It’s the category under which your ASIN is listed on Amazon store
How to use Customer Reviews & Ratings report?
Improve Ratings – By understanding products which have received lower ratings, go to the reviews and understand what customers are talking about, is it the quality, price, defect or any other issue about the product. Now pass on the feedback to the relevant team in order to improve the aspect which customers are complaining about.
Conclusion:
Amazon pi store analytics helps you to understand how your products are performing on Amazon. An effective strategy can be defined by improving search coverage, search ranking and learning from sales report. You should always compare your performance with your competitors and optimise your campaigns effectively, to drive more sales from your Amazon store!


July 12, 2022, 8:18 am
Hi i am trying to check for similar insights for Amazon US, UK, UAE, etc for my brand. How do we do that?
August 31, 2022, 5:41 am
Hi Juhi,
To get insights you need to have access to Amazon pi, you can write to them at contact-pi@amazon.com. Hope this helps!
February 17, 2023, 9:43 am
Hi, I am consulting for a brand who is new to the market- Amazon. How can I get the access for amazon pi for them.
July 11, 2023, 10:16 am
Please write at pi@amazon.com. The Amazon team will get back to you
July 8, 2023, 3:23 am
Hi I looked for amazon pi tutorial everywhere but i wasn.t able to find but this post is really helpful thanks for such an amazing post.
July 11, 2023, 10:17 am
Sure Roshan