Setting Up Site Search In Google Analytics
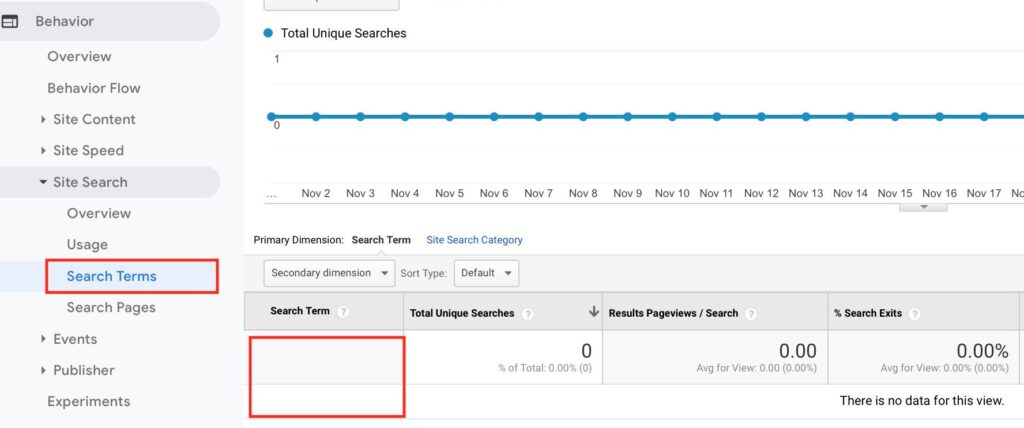
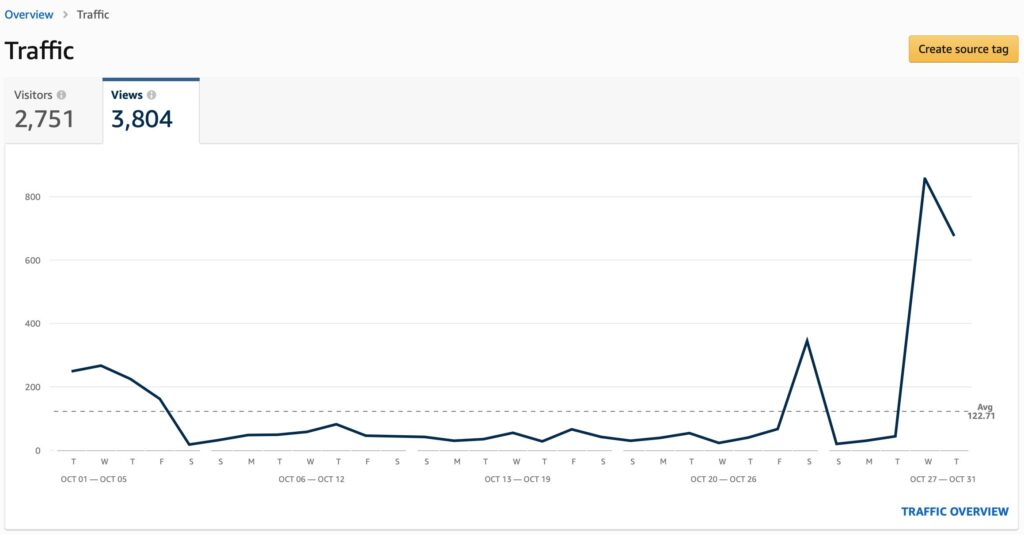
If you have a blog or an ecommerce website or a search box within your website, it’s important to know what users are searching on your website. With the help of site search option in Google Analytics, you can view the search terms used by users on your website. This option is available in Google analytics, but when you view the option, you won’t be able to see any data/search terms in the report, refer below screen. So How to Set Up Site Search in Google Analytics? Let’s understand step by step by taking an example. I am taking an example of my blog to show you how site search can be implemented through Google analytics. Step 1 Login to your Google analytics account – Login Step 2 Click on the admin section on the bottom left of your analytics account of your property, refer below Step 3 Now click on view settings and then switch on site search tracking as below. Now the site search tracking is on, but we need to capture the exact search term which the user used while searching. So let’s do a search on my blog with a search term as programmatic advertising as below. Now I get the search results page, with the URL as below. The URL is ?s=programmatic+advertising, where in the search term is added to the URL. Now, add s after switching on the site search tracking option on the analytics dashboard, as below. Now say save and your site search tracking setup is done. The search terms will start reflecting on your analytics dashboard after few hours. Here is the site search view of my analytics dashboard after few hours, where I can see different search terms searched by users on my blog which also includes programmatic advertising search term which we used above as an example. Conclusion You should set up site search in analytics as it allows you to understand the search terms used by users on your site, which also helps to build more content about those specific topics which users are searching on your blog or site. Implement site search tracking today in Google analytics and start building content around search terms today!
Guide To Google Responsive Video Ads
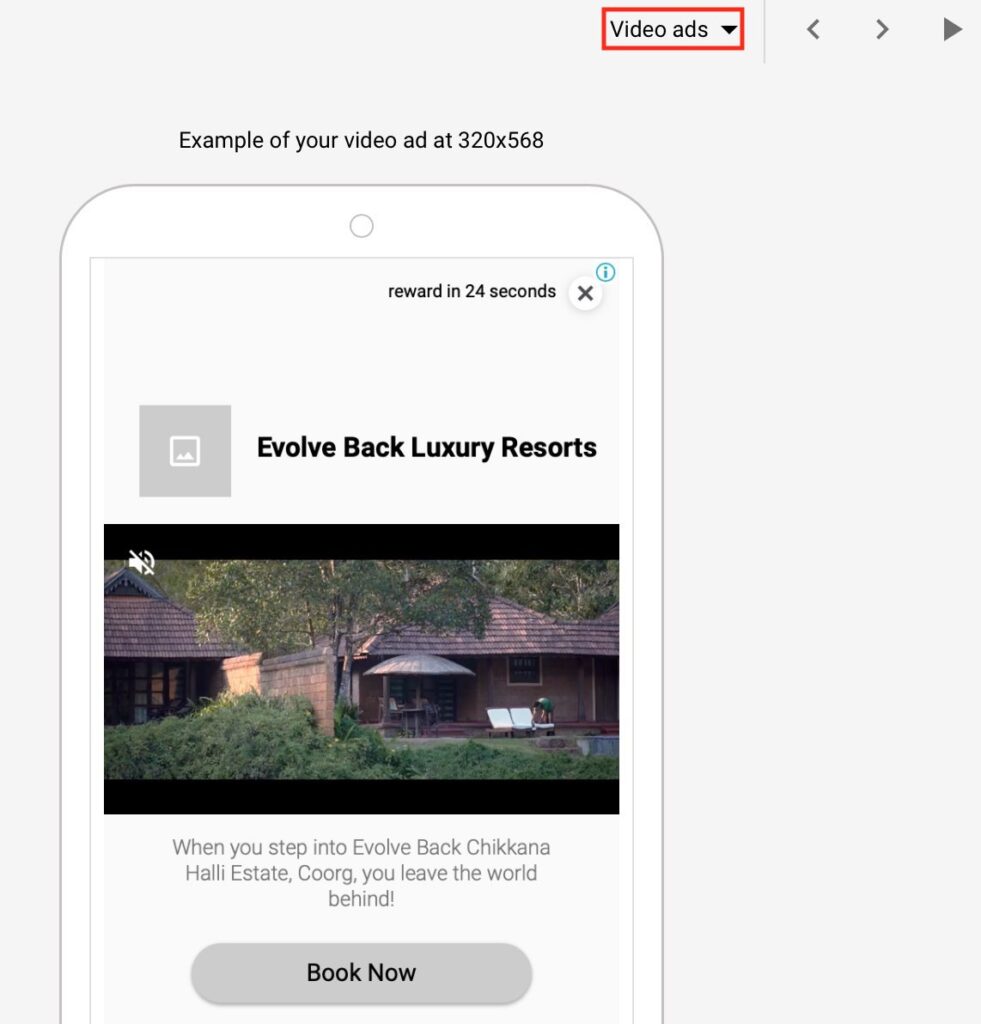
Google rolled out responsive video ads in Feb this year, but very few advertisers are know about it. So let’s understand what are Google responsive video ads and how to create them. What are Google Responsive Video Ads? Google responsive video ads are part of display ads, where advertisers can add upto 5 videos. These video ads will trigger in a display ad unit. Responsive ads automatically adjusts its appearance, size and format to serve on available ad inventory on Google display network. How to create Google Responsive Video Ads? In order to create a responsive video ads, you need to create a Google display campaign. If you are new to Google ads and don’t know how to create display campaign, refer article – An Ultimate Guide To Create Google Display Ads I am going to setup responsive display ads to my existing display campaign, so let’s understand step by step. Step 1 Once you have selected a particular display campaign, go to ads & extensions option in the campaign and select responsive display ads Step 2 Now define the destination URL and add logo and 1 image. I have added as below for reference. Step 3 Next is to define the videos in the assets. You can search for videos within the screen as below and can add upto 5 videos. Google will auto rotate these videos and show high performing video ad set oftenly. I have added four videos as below Step 4 Next step is to define headline. You can define upto 5 different headlines. I have defined 3 headlines as below. Step 5 Now you need to define long headline and description. Long headline should be 90 characters. You can add upto 5 variations of description. I have added 2 descriptions as below Step 6 Next step is to define business name and call to action. Business name is the name of your business. You can also set up tracking template at the ad set level, and also set up a mobile URL which is different than your desktop URL Define the call to action and you would be able to see the preview on the right hand side. May sure you select video ads in the preview option as below. Once the preview looks okay to you, just say save and continue. The ad will now go in review and will be live post Google’s review. Conclusion Google responsive video ads are very effective if you are looking to drive awareness and brand consideration. As upto 5 video content pieces are allowed, you can define a story about your product or service within the ad unit which encourages users to consider your business over competitors. Also I have observed higher CTR on responsive ads, so leverage responsive video ads today to drive traction! Related Articles: Ultimate Guide to Youtube Advertising Guide to Youtube Remarketing Ads
Generate More Leads From Google Lead Form Extension

Generating leads is one of the common objectives of businesses when they advertise through Google Ads. Advertisers use different ad types, bidding strategies & extensions to generate leads. Google has recently launched a new feature which will help advertisers to generate more leads for their business. What is Google Lead Form Extension? Google lead form extension is an ad extension which advertisers can add to their search ad copy to generate leads. The extension will be triggered on search ads only! Advanced Google Adwords Course by Rahul Gadekar – Access Now How to Create Google Lead Form Extension? Let’s understand how to create Google lead form extension step by step Step 1 Login to your Google ads account – Login Step 2 Go to a particular search campaign in your ad account to which you would like to define lead extension and then click on ads & extensions. Step 3 Now click on the blue button and then click lead form extension as below. Step 4 The next thing you will see the below screen. Now define the call to action and enter the extension text as below, you will be able to see the preview on the right hand side. Step 5 The next thing is to fill the details in the form. The form has below fields to be filled in Headline (30 Characters) – Add your value proposition Business Name – It’s your business name Description – Add more information about your business or service which you are promoting and why they should opt for your business. Form Fields – Name, Email, Phone number and Postal Code Policy URL – Add a policy URL or your landing page link Background Image – Add a background image which should a visual representation of your product or service Once you have filled the details, you will see a preview on the right hand side as below. Step 6 The last step is to create submission message. Submission message will appear once the users fills up the form. Make sure you add a call to action and link it to your landing page. Now save save and your lead form is created, it will go live with your ads post review. How to edit Google Lead Form Extension in Search Ads? In order to edit lead form extension, go to ads and extension, scroll down to lead form extension and click on the edit icon as below to start editing. Once you click on it, it will again take you to the lead form page, as discussed above in step 4 How to download leads from lead extension ? In order to download leads, click on download leads option as below on the ads & extensions tab, the leads file will start automatically downloading. The leads would be downloaded in a csv file. The data will be on the above file for only 30 days, so do make sure you download the data on time. Another way to download Google form extension leads is through webhook integration. Webhook integration can be used to connect Google sheets or a CRM platform, the leads will be automatically uploaded in Google sheets or CRM platform in real time. How to Setup Webhook integration for a Google Search Ads Lead Form Extension? Click on lead delivery option which is under lead form on the dashboard. You will see manage your leads with a webhook under lead delivery option, here you need to enter the webhook URL and key. What is Webhook URL? The webhook URL is the URL which links to the customer data management system where you’d like to receive your collected lead form data in real time. What is Key? The webhook key is a code sent with your data, which verifies it came from Google. Once you have added Webhook URL and key, say send test data to view the testing states and results. Webhook Integration Framework Source: Google What are the Different Types of Errors in Webhook? Error State A – This type of error would appear when the user saves the form but the data is not successfully sent. Error State B – This type of error would appear when the data is not been sent Error State C – This type of error would appear when the data was sent, but was not received by Google Error State D – This type of error would appear when the data is sent but Google receives an incorrect response like HTTP 200 Success State – Success state is when the data is passed and Google accepts it Conclusion Google lead form extensions are an effective way to generate leads through users searching on Google. The key part to generate maximum leads is to incentivise your product and service while running lead form extensions, so that they drive maximum leads to your business. Try Google lead form extensions and let me know how they are performing!
Ultimate Guide To Google Search Console
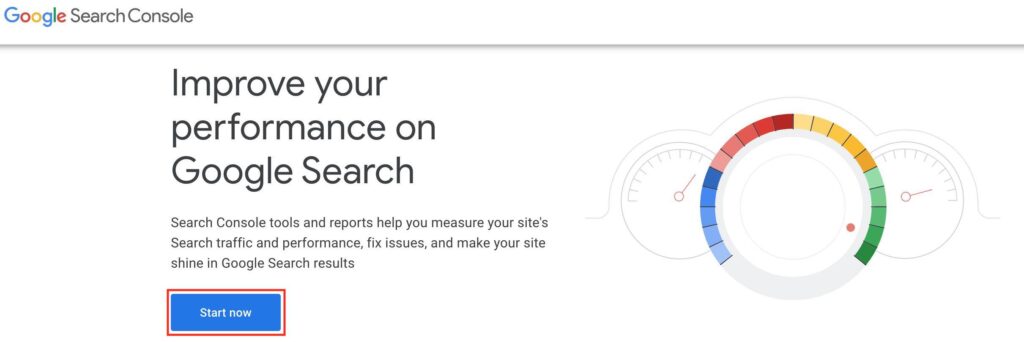
One of the important tools in SEO is Google Search Console. Google search console was previously known as Google webmasters tool. Google Search console is a tool which all businesses and marketers should use to improve their website performance in organic search. In this guide, I will take you through how to setup search console for your website, different features of search console, understanding technical aspects of your website & fixing them from SEO perspective. So What is Google Search Console? Google search console is a free tool by Google, which helps you to monitor and measure how well your site is performing in organic search results. It gives complete data of organic ranking of keywords, page rankings, crawl errors, top linking sites, structured snippets and AMP validation for your website. The data provided in search console is only about Google organic, it does not contain bing or yahoo organic search data. In order to access the search console data, you need to first setup search console for your website. How to Setup Google Search Console for your website? Step 1 Go to Google Search Console – Click here Step 2 Click on start now as below Once you click on start now, login with your gmail address through which you would like to create the search console account. Step 3 Now click on add property from the left side bottom Step 4 Now enter your domain of your website in the below section and say continue. Step 5 There are 5 ways to verify the ownership Upload HTML File You need to download the file (as below) and then upload the HTML file to your website. HTML Tag (Meta Tag) In this, you need to copy the meta tag and add in the body section of your website. Google Analytics You can verify ownership with the help of Google analytics account, provided you have setup Google analytics property and you have admin access to it. Google Tag Manager You can verify through Google tag manager provided you are using Google tag manager for your website. The tag manager ID is used to verify the site ownership. Domain Name Provider Last way is using domain name provider either through godaddy or any other domain name provider. From all the above the easiest way is to go with HTML tag (meta tag) How to set up Google Search Console with WordPress? Go to you wordpress backend and click on settings and add your website as below. Now copy the code from the HTML Tag (meta tag). Once you have copied the code, go to editor under appearance on wordpress and then click on theme header and then paste the code (meta tag) before the closing head as below Now say update and you search console property is verified. Now you can start seeing your website data under your search console account. Let’s understand each report/feature under search console! 1. Performance Report The first option after overview (which is a summary of search console), is performance report. Under performance view, once you select the data range, you will be able to see the total impressions, total clicks, average CTR and average position of your organic results. You can also compare data for the past month or custom period and check if the four metrics are dropping or increasing. If the metrics are dropping that means your average position is dropping. The next thing under performance report is queries report. With the help of this report you can view different queries for which your website appear on organic search, how many clicks you received, how many impressions it generated and what was the position of that keyword. This report gives you a clear indication which keyword is performing and which keywords needs more efforts to push ranking. Next to the queries option, you can see pages. With pages you can see the ranking of each page on your website, clicks received for that page, impressions generated and the CTR. When you look at the pages report you know which pages of your website are performing and which are not, basis that you can take to improve your SEO efforts. Next to pages option, you will observe countries option. Through this view, you will be able to observe which countries have generated clicks, impressions and the average position there. This also gives you an idea, as to which new geographies you should focus on in terms of marketing your business. Next to countries, you can see devices option. Through devices option you would be able to understand which devices are driving maximum clicks and how is your website ranking on each device. Next to devices, you can view search appearance report. With the help of search appearance report, you can understand whether your website appear in AMP non-rich results or web light results or AMP article or FAQ rich results and the average position for all these search appearances. Next to search appearance, there is a date option. With the help of date option you can measure clicks, impressions, CTR and average position on a daily basis. You can check how your performance is improving day by day and take necessary actions. 2. URL Inspection URL inspection option helps you to submit a URL for indexing. If your webpage is not indexed or you have uploaded a new page on the website, you can send a request to Google bot by URL inspection to index your page, Google will index your page on priority. 3. Coverage Coverage report shows the pages which has errors identified by Google. Below is how the coverage screen on search console will look like. My report is not showing any errors, but lets understand different types of errors which search console would show. 404 Error – 404 Error means that the bot saw a URL but has 404 error Soft 404 Error – Soft error 404 is shown when the bot observes a 404 error page but
Master Guide To Amazon Ads Optimization
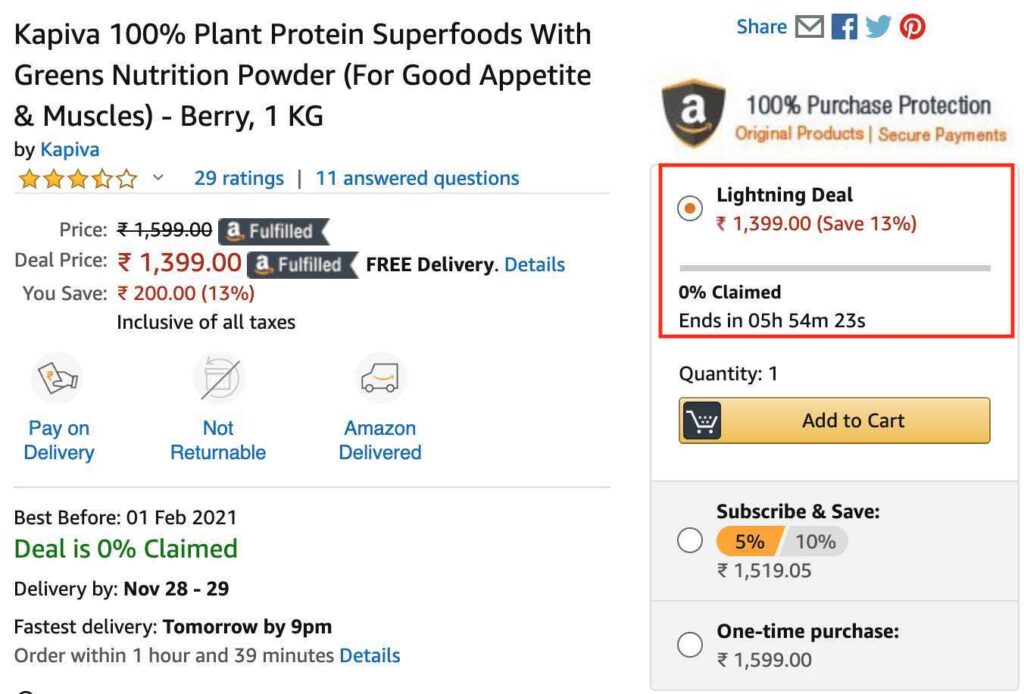
If you are regularly advertising on Amazon, it’s important to measure the performance and optimize to increase revenue on Amazon. In this article, I will take you through different metrics which you should look at while measuring your Amazon ads performance & ways to optimize them! So let’s get started! To get started login to your Amazon ads account here – Amazon AMS Login 1. ACOS The first important factor you should look at is ACOS. You should consider ACOS at the account level and then at a campaign level. Once you are on your dashboard, you will see the overall ACOS of your account, below is a screen from my Amazon account, where you can see that the ACOS is 21.78% which is quite You can then consider viewing ACOS at a campaign level, below is a screenshot of ACOS at a campaign level from my account. The ACOS for my second campaign is higher. In order to reduce ACOS of my campaign, I need to look at below aspects from my campaign: Keywords Keywords Match Types Negatives Differential Bidding Strategy CTR Conversion Rates To know more about reducing ACOS, refer article – Master Guide To Reduce ACOS on Amazon Ads 2. CTR The next metrics to look at is CTR. You can view CTR from your dashboard as below. Ideal CTR on your Amazon sponsored product ads should be atleast 3%. As it’s search type of ad format where there is an intent to buy products on Amazon, and if we are not able to achieve 3% also, then we are losing potential audience. So How to view search ranking of Amazon Ads? In order to view search ranking, you need to view Amazon Pi analytics. Amazon Pi will give you cumulative ranking of your products by considering organic & sponsored ads ranking. To know more about Amazon Pi Analytics, refer article – Master Guide to Amazon Pi Store Analytics So How do you increase CTR on Amazon? In order to increase CTR on Amazon, you need to increase search ranking on Amazon. For ranking improvement Amazon considers, A+ content of the page, conversion rates and purchase likelihood of your ad. 3. Conversion Rate Conversion rate is the next metrics which you should look at. The higher the conversion rate the higher the sales. For my first campaign, you can see that the conversion rate is 24.5%. On the dashboard, you won’t be able to see the conversion rate, so you will have to calculate it by orders by clicks x 100. So for the first campaign, 24.5% is very high. For the second campaign the conversion rate is 5.6% which is decent but can be improved further. How to improve conversion rate for Amazon ads? In order to improve conversion rate on Amazon ads, you can have to consider below factors: A+ Content The content has to be in detail with specific product keywords targeting in page titles, product description, FAQ’s, reviews and ratings. Value Proposition Highlight the value proposition effectively of the product, which helps to differentiate the product from the competitors. Pricing I have observed that pricing also plays an important role in improving conversions on your Amazon store. The pricing has to be competitive in the category or else it will be difficult to drive more sales, now this is a business call which the brand will have to take. But let’s say that the pricing has a difference compared to competitors, in that case you can go with lightning deal price which is available on Amazon and discount your product for a specific interval. What is lightning deal on Amazon? Lightning deal is a promotion offered in a limited quantity for a specific period (approx 6 hours) on Amazon store. Lightning deal can be activated by talking to Amazon team offline. How do lightning deal appear on Amazon? Lightning deal on Amazon page appear as below Trust & Credibility Factors Add trust & credibility factors which encourages users to consider your product. 4. Search Terms Next appect is to look at the search terms which are driving clicks to the campaign. You can view the search terms report by clicking a specific campaign and then clicking on search terms under an ad group, refer below From the search term report view which keywords are irrelevant and consuming budget, you can then add these keywords as negatives. 5. Keyword Match Types Look at the keyword match types which you have used in the campaign. Always go with phrase and exact match type of keywords to drive relevant clicks which will then drive more conversions. If you are using broad match type, see the search term report and exclude keywords which are irrelevant. Broad match types are good to increase the visibility of your products on Amazon. 6. Automatic Targeting Avoid usage of automatic targeting campaigns. Automatic targeting will consume budgets with a higher ACOS. If you are new on Amazon, you can go with automatic targeting as your key objective would be to drive visibility. But if you are looking for sales only, avoid usage of automatic targeting. Also when you use automatic targeting while driving visibility, read the search term report and understand the actual keywords searched by users and add them as keywords in your manual campaign. Conclusion Monitoring the performance of these metrics and optimising them is the key to drive results for your Amazon sponsored ads. Focus on optimising keywords more initially and then the metrics because if the intent is high for a keyword, other metrics would improve significantly! Related Articles: Guide to create high performing Amazon sponsored product ads Guide to create high performing Amazon sponsored brand ads
Amazon Store Analytics To Drive Higher ROI
If you are using Amazon to drive sales, it’s important for you to understand Amazon insights of your store, which will help you to optimize and drive more conversions on Amazon. What is Amazon Store Analytics? Amazon Store analytics is an analytics platform of Amazon within AMS, which helps to understand the traffic on your Amazon store, sales on Amazon store, page visits and sources of traffic on your Amazon store. How to access Amazon Store Insights? In order to access Amazon store insights, log on to your AMS account and then click on the top left hand side of the dashboard, post that click on stores as below. Once you click on stores, you will see the below screen with your store name and store URL, now click on see insights to go to the insights dashboard. Let’s now go to the dashboard and understand in detail! Understanding Amazon Store Insights The Amazon store insights dashboard has 5 options as below: Overview Traffic Sales Pages Sources Overview Overview report option gives you a summary of the total visitors on your store, views/visitor, total sales, total units sold and orders. Below is how the overview screen looks like. Apart from the summary, it also gives you a summary of traffic, sales, pages and sources, which we will deep dive ahead in this article. Through overview report, you can understand how sales are happening for a particular period and also compare it with the previous month. You can also download the report from this view! Traffic Traffic reporting option helps you to understand how many visitors are coming on your store day to day, which helps you to understand if traffic is increasing or decreasing day to day on your Amazon Store. These visitors are unique visitors on your store. Below is how the screen would look like on the dashboard. You can see that the visitors increased on 28th October, this was because I started advertising on Amazon. You can then related to how many orders you generated basis the growth in traffic. After visitors, you can also see views on the dashboard as below. Views are total page views for the period selected, the page views also includes repeat views. You can read views from the dashboard by understanding how they are improving day by day. Sales With the help of sales reporting view, you can understand the total revenue generated, total units sold, total orders, sales per visitor and units per order. You can compare sales report month on month and see how the sales are increasing or decreasing and then optimise your store. Pages Pages report is a very important report to view, as it helps you to understand which pages are driving how much sales, how many orders, how many units, how many units per order, views etc. Below is how the first screen on the pages dashboard looks like, you can filter data by clicking on sales or orders button as in the below screenshot. The second screen in the pages section, helps you to understand page level data of all the pages on your store. It gives visits, views, orders, sales, sales per visit and units per order for each page on your store, which helps you to understand which page is performing better and then you can move budgets towards selected pages for advertising. You can further deep dive at a specific page level by clicking on a particular page. For eg: I have clicked on the first page as per the above screen which has 2,541 visits, post that I can see a new page with the below screenshot which gives total views, sales, units sold and order. Now once I further scroll down, I can see the source level data for other sources, Amazon organic traffic and Amazon sponsored brand (Amazon paid ads) traffic as below. For each source I can further see data of visits, views, orders, sales, sales per visit and units per order. You can see the majority of the data is recorded at other sources level, which is because I am diverting traffic from Facebook ads to my Amazon store. You can also create tags to measure Facebook traffic data or Google Ads traffic data on your Amazon store. In order to view other sources data apart from Amazon click on your tags (as per above screenshot, next to source), you will observe the tag level data of different sources apart from Amazon, refer below screen. Note: The data will only populate if you have created tags in advance The tags report helps you to understand if campaigns outside Amazon are performing or not in terms of sales. It’s very important for you to define tags because if campaigns are not performing, then you switch budgets or optimize your campaigns. These are the reporting options on Amazon store analytics/insights to view, monitor and then take further decisions. Conclusion: It’s very important to keep monitoring your Amazon store analytics data every week to learn and then optimize. The key reports which you should monitor are pages report, sales report and sources report. Keep measuring different metrics under these reports and optimize your store to improve sales. If you want to further deep dive on Amazon store analytics, you can also use Amazon Pi analytics to understand search term report, search ranking, sales by geography, share of voice and brand recall! Master Guide to Understanding Amazon Pi Analytics Related Articles: Ultimate Guide to Amazon Advertising
Beginners Guide to Programmatic Advertising
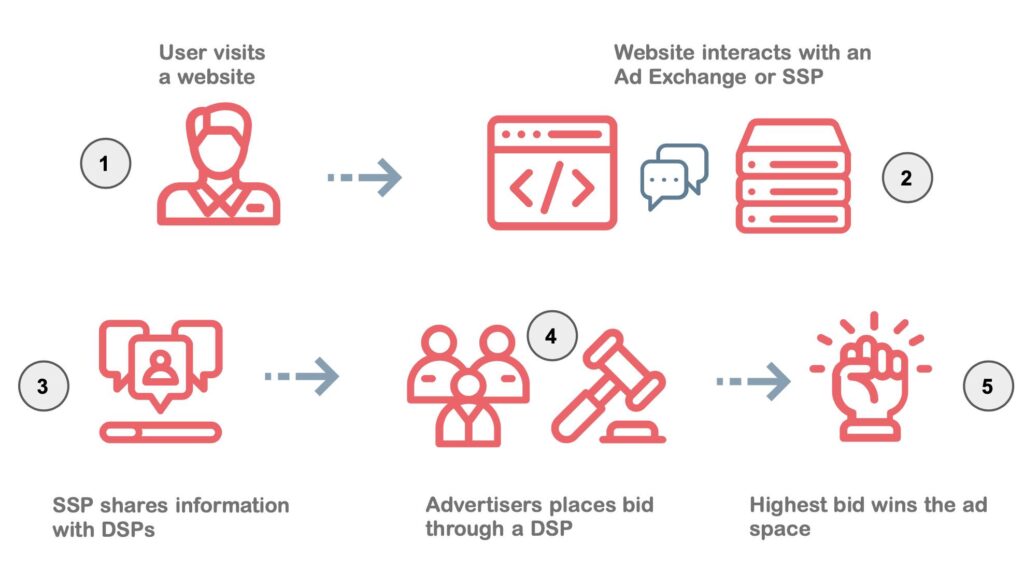
Programmatic advertising is changing the face of digital advertising across the globe. Programmatic is evolving and most of the advertisers are adopting programmatic strategies to grow their business as it has better targeting capabilities compared to regular media buying. Projected Programmatic Ad Spends Worldwide (Source: Zenith) What is Programmatic Advertising? Programmatic advertising is the method of buying and selling of digital advertising space through an automated process! What are the different formats of Programmatic Advertising? Different formats of programmatic advertising includes: Outdoor advertising (electronic display boards) Television Display Video Search Programmatic Advertising Framework Below screen explains the programmatic advertising framework. Let’s understand in detail! Publishers list their inventory on Ad exchange, ad exchange is a marketplace where publishers and buyers come to sell and buy inventory. Ad exchange examples: Google ad exchange, Microsoft ad exchange etc SSP commonly known as supply side platform is a media selling platform, from where you can sell inventory in an automated way. SSP examples: Google, AppNexus, AOL etc Ad Networks are networks who are connected with multiple publishers, from where advertisers can buy inventory. AD Network examples: Google Display Network, Komli, Tyroo etc DSP commonly known as demand side platform, is a media buying platform, from where you can buy inventory in an automated way. DSP examples: Google, MediaMath, Turn etc DMP commonly known as data management platform is a platform which captures data, this data is then used by DSP’s to target audiences with different segments. Most of the DSP’s have DMP’s which helps them to drive more value from programmatic media buying process. Third party data is a collection of different kinds of data including demographic, interests and behaviour. Third party data is commonly used in programmatic media buying. ATD, also known as agency trading desk is a platform within the agency to buy bulk media from different publishers. They reduce the traditional way of buying media and automates the process. Programmatic Bidding Framework Below is how the programmatic bidding framework works The user visits a website, the website then communicates with an ad exchange or SSP. A request is sent from SSP to DSP, advertisers places a bid through DSP to buy an inventory, the highest bid wins the auction and the ad is served on the website. Different Types of Programmatic Deals Open Auction: In open auction deal, all buyers have access to inventory and can place bids on any inventory available on ad exchange which is open. Preferred Deals: In preferred deals, inventory is directly bought from the publisher through programmatic. It’s a pre-auction deal with one buyer in fixed price from a selected publisher. Guaranteed Deals: In guaranteed deals, advertiser commits to buy specific volume of inventory from a selected publisher. It’s a pre-auction deal from selected buyers at a negotiated or a fixed price. Private Auction: In private auction, selected buyers are allowed with a set floor price. Different Types of Data in Programmatic Advertising? There are 3 types of data in programmatic advertising: 1st Party Data 2nd Party Data 3rd Party Data What is 1st Party Data? 1st party data is the data collected from source which includes Data of actions or interactions or behaviour of the audiences on your website Data which in in your CRM List data Subscription data Social Data 1st party data is the most valuable data because it comes directly from the source of your website or CRM or social channels. This data can also be collected using a data management platform and create segments to personalise communication to the audience. What is 2nd Party Data? 2nd party data is the data purchased from a vendor or a publisher directly. This difference between 1st party and 2nd party data is, the 2nd party data is purchased from another source, whereas, 1st party data is the data from your source. What is 3rd Party Data? 3rd party data is the data purchased from data aggregators. These aggregators purchase data from publishers and from the source, where the data was generated. Targeting Parameters in Programmatic Display Advertising? There are different targeting parameters in programmatic display advertising, let’s understand in detail: Demographics : Demographics targeting includes targeting by age, gender and location. You can also target users basis hyper local targeting Placements: Placement targeting includes, you can target audiences by websites, mobile applications, specific sections within website/app Technology: You can target users basis device type, specific devices, browser types and specific operators through programmatic Behavioural: Behavioural targeting is one of the key aspects of programmatic advertising, which makes programmatic different from traditional display ads. Behavioural targeting includes targeting users basis their behaviour on the web, learning from their interests, browsing patterns, content consumption patterns and then targeting them. Also, when you understand the behavioral patterns of users on your website, you can create custom lists, which then can be used for crafting personalise messages to users with dynamic creatives through the marketing journey. Data Targeting: Data targeting is another aspect which makes programmatic more valuable than regular display advertising. You can leverage second party and third party data to create more intent based and relevant messages across the user journey. Benefits of Programmatic Advertising Programmatic advertising has multiple benefits over traditional advertising, let’s understand each one of them: Automated Media Buying Programmatic advertising automates the entire process of media buying. You don’t have to talk to multiple publishers while buying inventory, it cuts down the offline process of sharing insertion orders and approvals to buy inventory, which saves time and effort at both ends including advertiser and publisher. Effective Targeting Programmatic advertising allows precise targeting basis users behaviour, custom lists and content consumption patterns. This makes the ads more relevant to the users, leading to higher click-through rates. High Inventory Quality The quality of inventory bought through programmatic is high, as you have options to choose from preferred deals and private auctions. So your ads are shown on high quality inventory options, helping you to gain maximum traction for the media investments. Cost Effective
Sequential Messaging: Storytelling on Digital Marketing

In today’s digital world, consumers are bombarded with ads across devices. It’s also difficult for them to notice it or even remember it. Also, showing a single message to your audience might not get traction and build engagement. So how does a brand communicate with their audience effectively and build interactions?, that’s when sequential messaging comes into the picture. What is Sequential Messaging? Sequential messaging is a marketing technique of telling a story to your audience with a sequence of messages related to a particular product or a service. These ads appear across devices such as mobile, tablet & desktop, helping brand build a deeper relationship with their audiences. Types of Sequential Messaging? Display Sequential Messaging Video Sequential Messaging Programmatic & DCO Sequential Messaging (leveraging data points) How does Sequential Messaging Works? In sequential messaging, you craft different messages and create ad units for each message. These messages can then be defined in a sequence and shown to users one after the other which build the storyline of your product or service. Let’s take an example and understand this! Below is a case study of sequential messaging campaign which we did for a real estate brand and it helped us to boost conversions. We did a display sequential messaging campaign through programmatic and this is how we developed a story about the real estate project we were promoting. The first ad unit starts with probing message, where we were trying to find the audience who were looking for a home in Baner, Pune (India) The second ad unit message teases the audience with a message, “Your Paradise Awaits You”, which builds in curiosity about the property. The third ad set message highlights about the luxury aspect of the property with interior visuals. The fourth ad set communicates about the high rise of the property. The fifth ad set communicates about deal while buying the property, which is a pull factor. The sixth ad set message communicates about the users who have bought an apartment in the project. It also highlights testimonials alternatively so that it builds trust within the audience targeted. With the help of sequential messaging we were able to identify users who were looking for property and communicate different aspects about the property while they were browsing on the internet, leading to higher conversion rates. Let’s have a look at another example for an ecommerce brand! Below is a case study of Dynamic Creative Optimization (DCO) sequential messaging which we did for Flipkart, targeted to the users who visited a product page but did not transact. In this scenario, we communicated different attributes of the product to the users and encouraged them to transact with the power of sequential messaging. Flipkart Sequential Messaging Campaign We researched and realised that most of the users while buying a phone look for camera, capacity, performance, display, reviews and price points. So we defined the sequential messaging campaign with these aspects to the users who visited Samsung Galaxy J7 pro product and did not transact. The first ad set communicates about, “Best Camera for Low Light Pictures” The second ad set communicates the performance of the phone, including memory and display, which are one of the key factors while buying the phone. The third ad set talks about the ratings and reviews, and also it states that it is the most sold phone in the last 24 hours The fourth ad set communicates about lowest price, exchange, buyback and extra discount, which encourages the user to consider the phone. If the user is still taking time to buy the phone, the fifth ad set offers him a special discount which does the final job of sequential messaging. The sequential messaging approach helped us to drive more CTR’s and increase the conversion rates drastically. Video Sequential Messaging Video sequential messaging is sequencing with the help of video format.Video sequential messaging is available in YouTube ads and can also be done through programmatic video ads. Below is an example of Youtube video sequential messaging campaign which we did for Evolve Back Resort, Coorg. The first ad set communicates about coorg being a green paradise and chikkanahalli estate in coorg The second ad communicates about the elegance of the resort property. The third ad set communicates about the land, the harmony of tradition & luxury within the property The fourth ad set communicates about the different aspects in detail about the resort Video sequential messaging is very impactful as each video is a message in a story format, and video sequencing helps to continue the story to a specific user when they are on video properties. How to use Sequential Messaging effectively? In order to define an effective storyline & drive more conversions, focus on the below aspects: Engaging Messaging The messaging of all the ad sets should be engaging and impactful. You can use emotional messaging, humorous messaging or probing messaging, depending on the type of product you are marketing. Highlight Value Proposition When you are building your story sequence, try to focus on your value proposition, because that’s going to make you stand apart from the competition and it will encourage users to consider your product or service Highlight Attributes Make sure you highlight the attributes of the products effectively in the sequence, which gives users and idea about the key aspects of the product or service. Leverage Data Points Leverage data points and start the sequential messaging journey from there. For eg: You can start the journey from where the users have dropped off, for ecommerce – you can start the journey from where the users have abandoned their cart. You can also create different segments basis visitors interactions on the website and then use these data points to start the sequential messaging story. Conclusion Sequential messaging is one of the most effective digital marketing techniques which helps to boost sales in new user acquisition and remarketing. The success of sequential messaging will depend on what story you are communicating to
Master Guide To Amazon Pi Store & Search Analytics in 2025

As we know Amazon is one of the preferred channels to drive sales for retailers, it’s important for retailers to understand in detail, how the users are behaving on their Amazon store and how can convert these shoppers, that’s when Amazon Pi comes into the picture. So What is Amazon Pi? Amazon Pi is an Amazon analytics platform for brands selling products on Amazon with deep insights on different aspects including customer search terms, search ranking, share of voice, brand recall, sales by geography, search analytics and alternate purchases. With the help of Amazon Pi insights, sellers can leverage data for Amazon organic and Amazon ads, and define a robust strategy to drive more sales on Amazon store with lower ACOS. This guide will help you to understand each and every reporting aspect of Amazon Pi. So let’s get started! How to access Amazon Pi Analytics? Amazon Pi login What are the Different Reports Available in Amazon Pi? Different reports available in Amazon includes Awareness Search Performance Product Search Ranking Display Advertising Share of Voice Consideration Product View (Glance View) Report Alternate Purchase Purchase Sales By Geography Market Basket Price Distribution Loyalty Customer Reviews and Ratings Let’s understand each report in detail: 1. Awareness report in Amazon Pi a. Search Performance The Search Performance report helps you to understand how your Brand is performing on Amazon Search. The Search Performance report can be used to identify top ranked keywords for your products, and then target these keywords in your Amazon ad campaigns to improve discoverability of your products on top searched keywords. Once you click on search performance report option on Amazon pi, you will first come across below screen. You can filter the report by subcategories or brand and then by time period for which you want to view the report for. You can then see brand recall as the first section under search performance. Brand recall section helps you to understand if the brand search are increases or decreases for your brand on Amazon. In the below screen, you can see that my brand searches are constant for 3 months. If you brand searches are decreasing, you need to start with sponsored ads to increase visibility. The next section under search performance is Search Coverage. What is Search Coverage? It shows, how much presence do you have on the first page of search results (including Sponsored Products). (Note: I have explained below in download report options, about how to read search coverage report and drive more value for your business on Amazon) The next section is keyword performance. Keyword performance report helps you to understand the performance of the top keywords in your category over the last 7 days. You can then download the report to understand in detail about search performance. Once you download the search performance report, you can view the following columns in the report: Keyword Total Search Coverage Sponsored Search Coverage Organic Search Coverage Traffic Top Display Organic ASIN Top Displayed Organic ASIN Title Top Displayed Sponsored ASIN Top Displayed Sponsored ASIN Title Top Clicked Organic ASIN Top Clicked Organic ASIN Title Top Clicked Sponsored ASIN Top Clicked Sponsored ASIN Title Let’s understand each one of them: Keyword – This helps you to understand the keyword on which your products were displayed in the search result. Total Search Coverage – Total search coverage is similar to impression share on a particular keyword. Total search coverage gives you an idea about the impression share which you have achieved for a particular keyword on Amazon search. The total search coverage includes coverage of organic and sponsored search in the reporting column. The search coverage should be at least 70%. If the search coverage is less than 70% you need to improve your search ranking on Amazon Sponsored Search Coverage – Sponsored search coverage is the impression share for your paid campaigns on Amazon search. If you have recently started your Amazon ads, you need to increase your sponsored search coverage by focusing on the intent based keywords with the right match types and bidding strategy, which will help you to rank higher leading to higher sponsored search coverage. Organic Search Coverage – Organic search coverage is the impression share for your organic results on Amazon search. In order to increase organic search coverage, Amazon considers couple of parameters which includes your search ranking, A+ content, conversion rates, purchase likelihood and CTR’s. If you don’t want to spend more on Amazon, you need to improve your organic search coverage which will lead to higher sales on Amazon and lower ACOS from sponsored campaigns. Traffic – Traffic column gives you an idea about the search volume of a particular keyword in the report. Once you download the report, you will see the search volume in range eg: 1k – 10k. So it’s difficult to actually understand the search volume of a particular keyword right now from this report, hopefully Amazon in further will help us with the exact search volume of a keyword. Top Displayed Organic ASIN – Top displayed organic ASIN will help you with the ASIN number which was displayed for a particular keyword. This ASIN can be your competitors product, you can do an analysis of this product detail page and study why this page is ranking on Amazon organic search. Top Displayed Organic ASIN Title – Top displayed organic ASIN title column report will help you understand the top displayed organic product ASIN title for a particular keyword. By studying these product titles, you can see how the keywords are defined to these product pages and then optimise your product titles. Top Displayed Sponsored ASIN – Top displayed sponsored ASIN will help you to understand the ASIN number of the product which was displayed as sponsored results for a particular keyword. You can again study the product page of this ASIN and optimise your content, as this page is ranking on sponsored search results. Top Displayed Sponsored ASIN Title – Top displayed sponsored
An Ultimate Guide To Facebook Page Insights
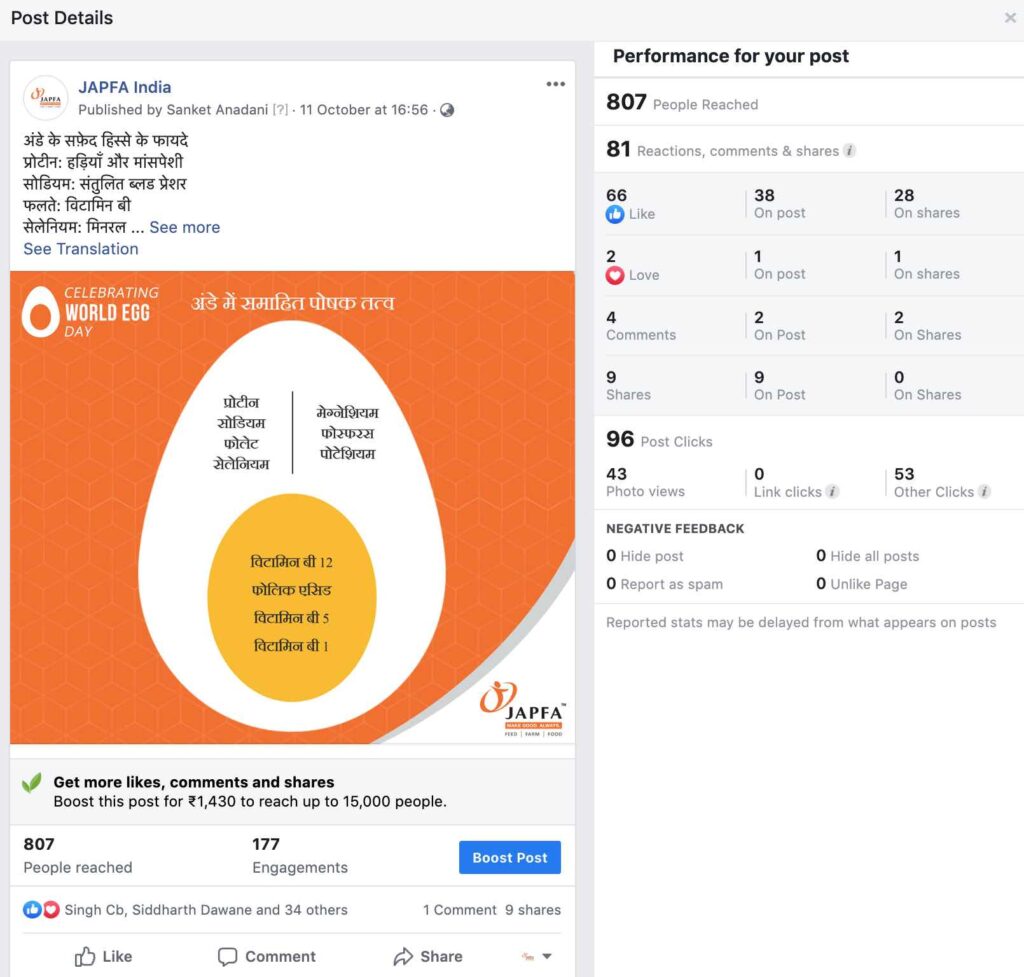
Facebook page is one of the important profile of your brand on social media. Every brand has a different social media strategy to drive engagement on their Facebook page. Brands define different campaigns, contests, engagement activities and content pieces to interact with the audiences on Facebook, but not every time the strategy or content piece works. In order to understand if your strategy is working or not, it’s important to understand the audience insights, that’s when Facebook insights comes into the picture! So What is Facebook Insights? Facebook insights is Facebook analytics which helps your to understand different aspects of your Facebook page including engagement, reach, likes, comments, shares and demographics. Facebook insights helps you to understand how your content strategy is performing on Facebook! Where to find Facebook Insights on Facebook Page? Once you are on your Facebook page, you will see insights on the navigation bar. Once you click on the insights option, you will see the below screen Advanced Facebook Advertising Course by Rahul Gadekar – Access Now How to use Facebook Insights? Let’s understand each aspect in detail about Facebook Insights 1. Overview The first tab in Facebook insights is overview of the page. The overview option is further is further divided into 3 aspects including Page Summary Your 5 Most Recent Posts Pages to watch Page Summary Below is how the page summary looks under overview option Page summary gives you a glace about different metrics including likes, post reach, page views, story reach, actions on page, post engagements, video views, page followers and orders. Page summary also compares current date range data with previous period. For Eg: In the above screenshot, you can see in the post reach metrics there is a 3% increment (green color indicates increment and red colour indicates decrease), now the data is compared with the last 28 days vs previous 28 days. This gives you a quick glance of which metrics has improved and which has not. You should weekly monitor each metrics to understand the improvement and take necessary action. Your 5 Most Recent Posts The next option in summary is, “Your 5 Most Recent Posts”. You need to scroll down to view this option, it would look like the below screen. This option helps you with the recent 5 posts with the reach and engagement metrics. If you click on a specific post, it further helps you to understand the performance of that post in detail including like, comment, shares, photo views and link clicks This report helps you to understand what type of content is performing well which you have recently posted on your Facebook, you can then further define a strategy to post similar kind of content to drive more engagement. Pages to Watch The next option is pages to watch Pages to watch option helps you to compare the performance of your page and posts with your competitors page. You can also add a specific page through the option add pages and start comparing. If you want to go to the page and deep dive on content, you can just click on the page name. From the overview section, you can also download the entire data to do deep dive analysis. You can download the same by clicking on the export option from the summary section as below Once you click on the export data option, you will come across below screen. You can download the data in data type as page data, post data and video data by selecting a specific data range. Let’s understand each data type in brief: Page Data – This data type will help you to view key page metrics for engagement, lifetime total likes, daily new likes, daily unlikes, daily page engaged users, weekly page engaged users, daily total reach, daily organic reach, daily paid reach, viral reach and total impressions Post Data – This data type will help you to view post level data for key metrics of each post including organic reach, paid reach, engaged users, organic impressions, paid impressions and lifetime negative feedback Video Data – Video data will help you to view video data for key video metrics including video views, impressions, 30 seconds views, 60 seconds views, auto-played video views, paid video views and organic video views 2. Followers The next option in Facebook insights is followers Once you have selected the rate range under followers option, the first thing you will see is the total page followers as of today, refer below screen. This gives you an idea how the followers growth has been on your Facebook page. The next thing in followers option is net followers. Net followers graph helps you to understand how many unfollows were there, how many followers were generated organically, how many followers were generated through paid media and what are the net followers for the period selected. After net followers, you will see where your page follows happened, either they happened on your page or search or page suggestions or on your posts or uncategorised desktop. You can further break it down by each, by clicking on the right hand side option, refer below screen, where I have clicked on uncategorised desktop which helps me with specific details about uncategorised desktop where the follows happened. 3. Likes The next view in Facebook insights is likes. Once you have selected the date range, the first thing you will be able to see is total page likes as of today with a break up day by day for the selected date range. Through this you will be able to understand how your likes are increasing day by day. Next thing is net likes. Net likes view helps to understand unlikes, organic likes, paid likes and net likes day by day. From this you can see how your organic likes are increasing day by day and how your unlikes are happening day by day. The next thing under net likes is, where your page likes happened. This option

