If you are using Amazon to drive sales, it’s important for you to understand Amazon insights of your store, which will help you to optimize and drive more conversions on Amazon.
What is Amazon Store Analytics?
Amazon Store analytics is an analytics platform of Amazon within AMS, which helps to understand the traffic on your Amazon store, sales on Amazon store, page visits and sources of traffic on your Amazon store.
How to access Amazon Store Insights?
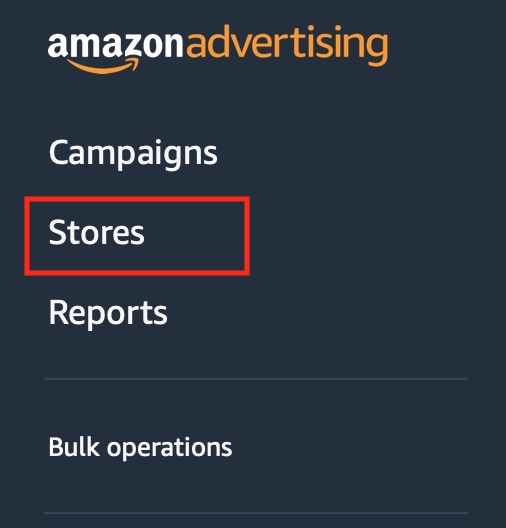
In order to access Amazon store insights, log on to your AMS account and then click on the top left hand side of the dashboard, post that click on stores as below.
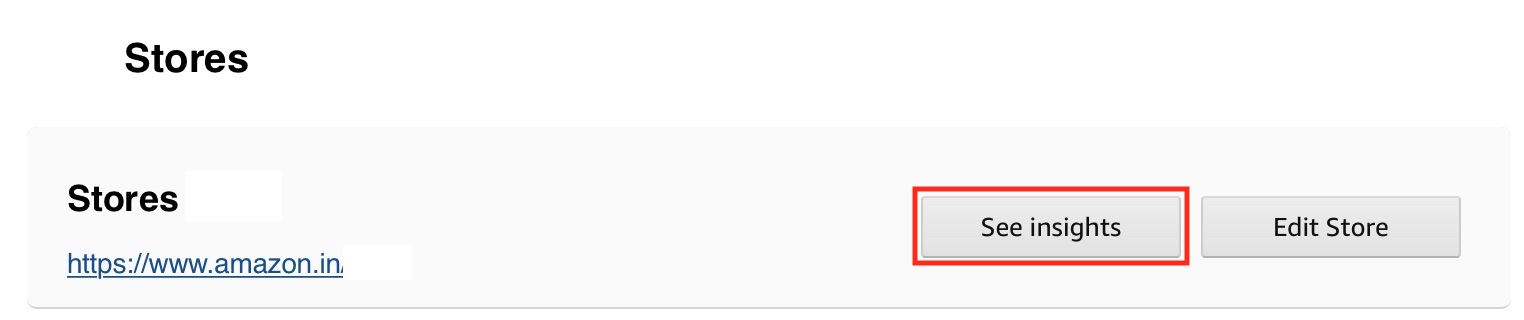
Once you click on stores, you will see the below screen with your store name and store URL, now click on see insights to go to the insights dashboard.
Let’s now go to the dashboard and understand in detail!
Understanding Amazon Store Insights
The Amazon store insights dashboard has 5 options as below:
- Overview
- Traffic
- Sales
- Pages
- Sources
Overview
Overview report option gives you a summary of the total visitors on your store, views/visitor, total sales, total units sold and orders. Below is how the overview screen looks like.
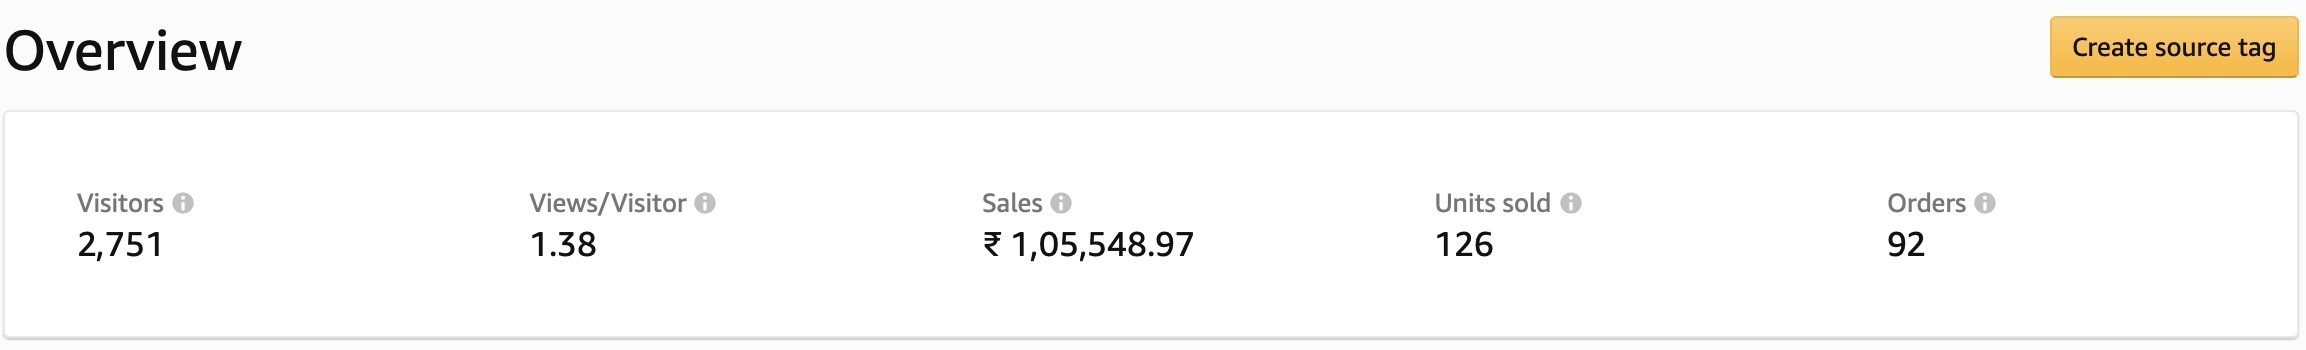
Apart from the summary, it also gives you a summary of traffic, sales, pages and sources, which we will deep dive ahead in this article.
Through overview report, you can understand how sales are happening for a particular period and also compare it with the previous month. You can also download the report from this view!
Traffic
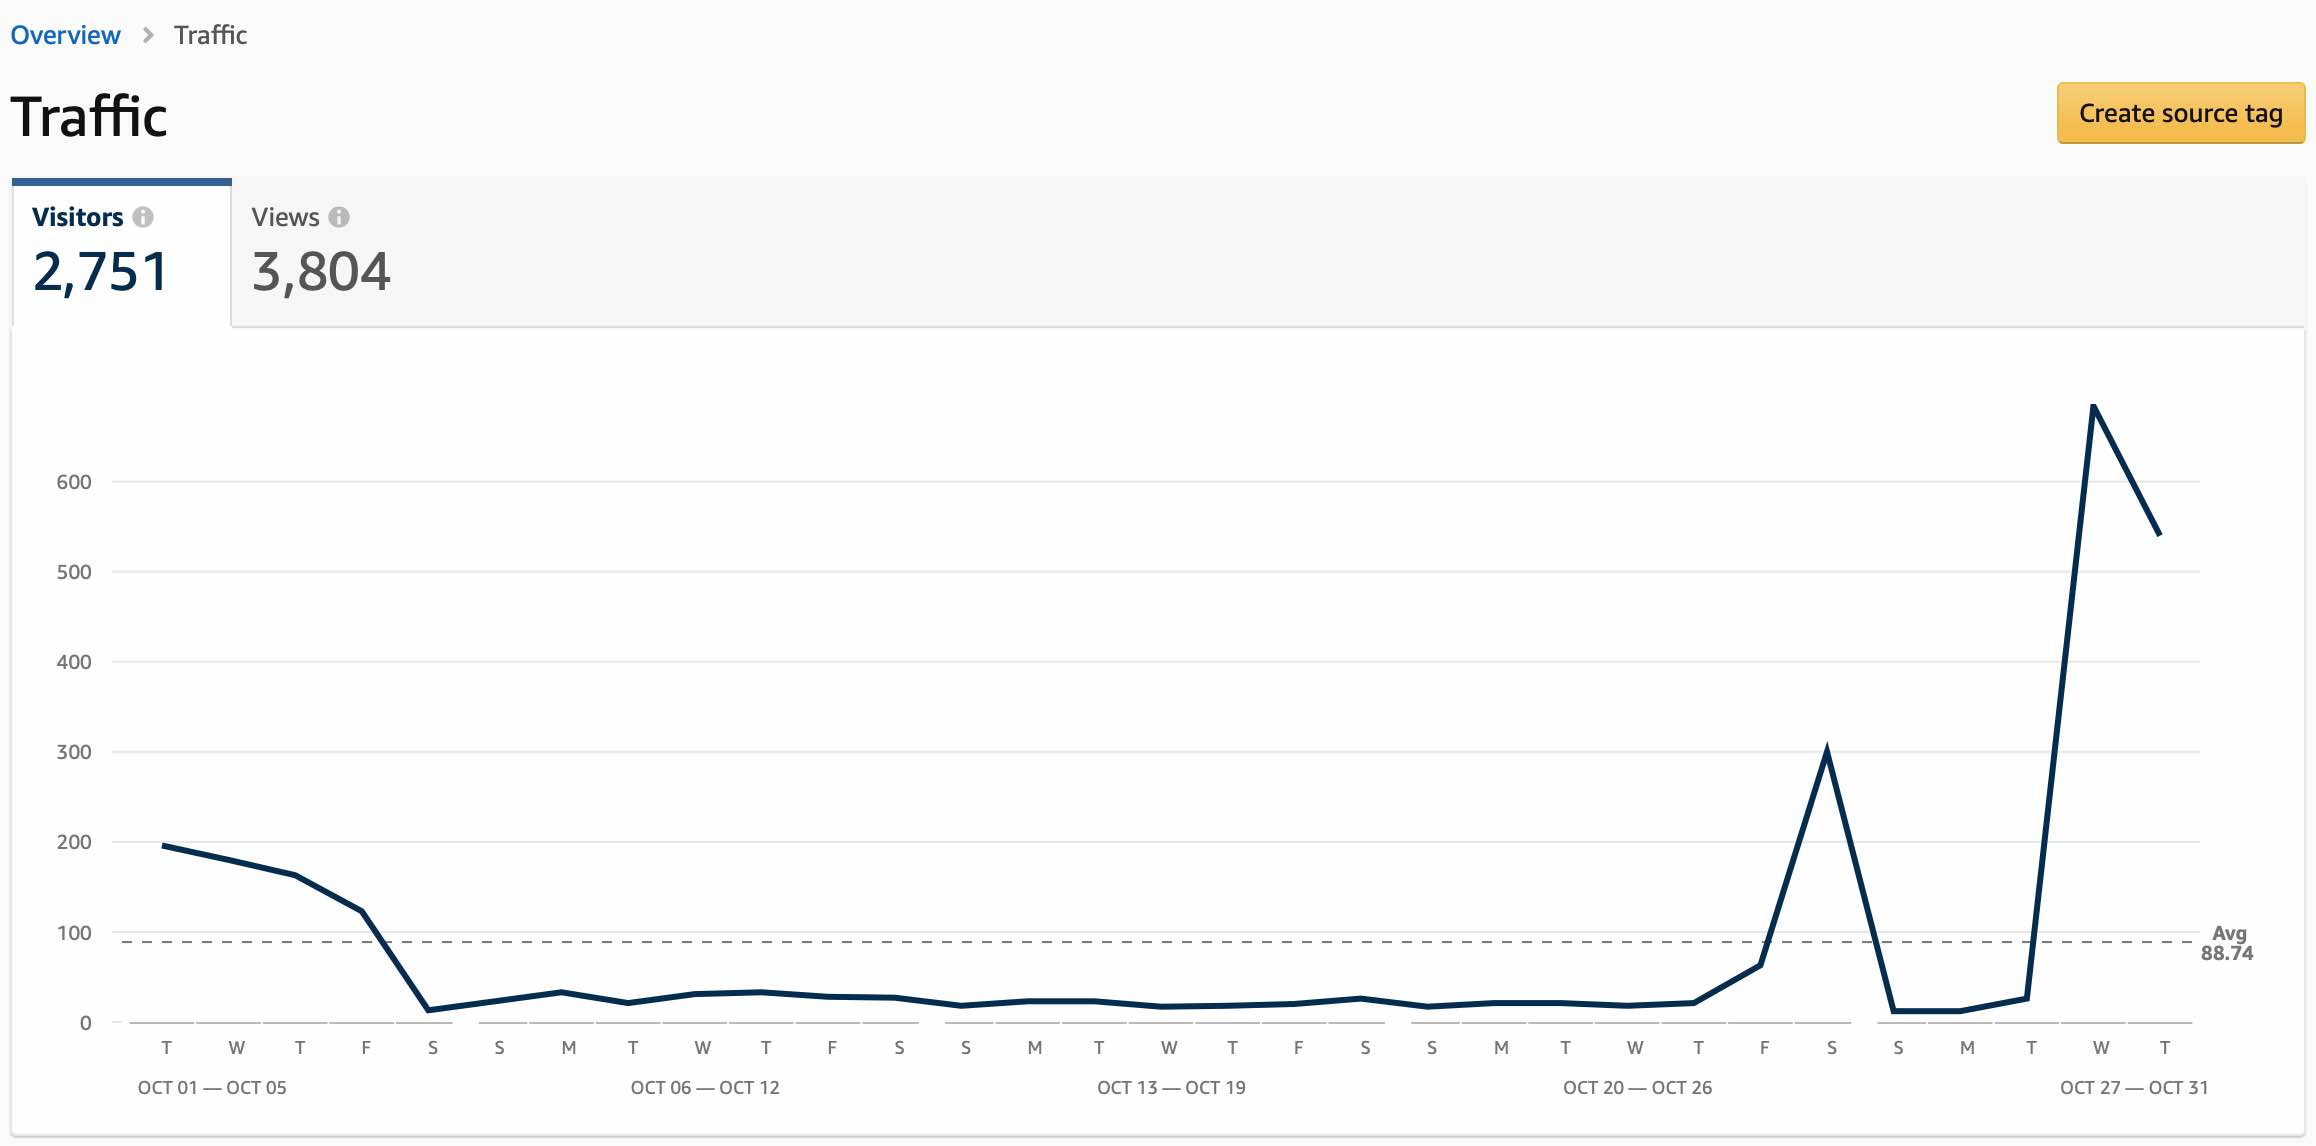
Traffic reporting option helps you to understand how many visitors are coming on your store day to day, which helps you to understand if traffic is increasing or decreasing day to day on your Amazon Store. These visitors are unique visitors on your store.
Below is how the screen would look like on the dashboard. You can see that the visitors increased on 28th October, this was because I started advertising on Amazon. You can then related to how many orders you generated basis the growth in traffic.
After visitors, you can also see views on the dashboard as below. Views are total page views for the period selected, the page views also includes repeat views.
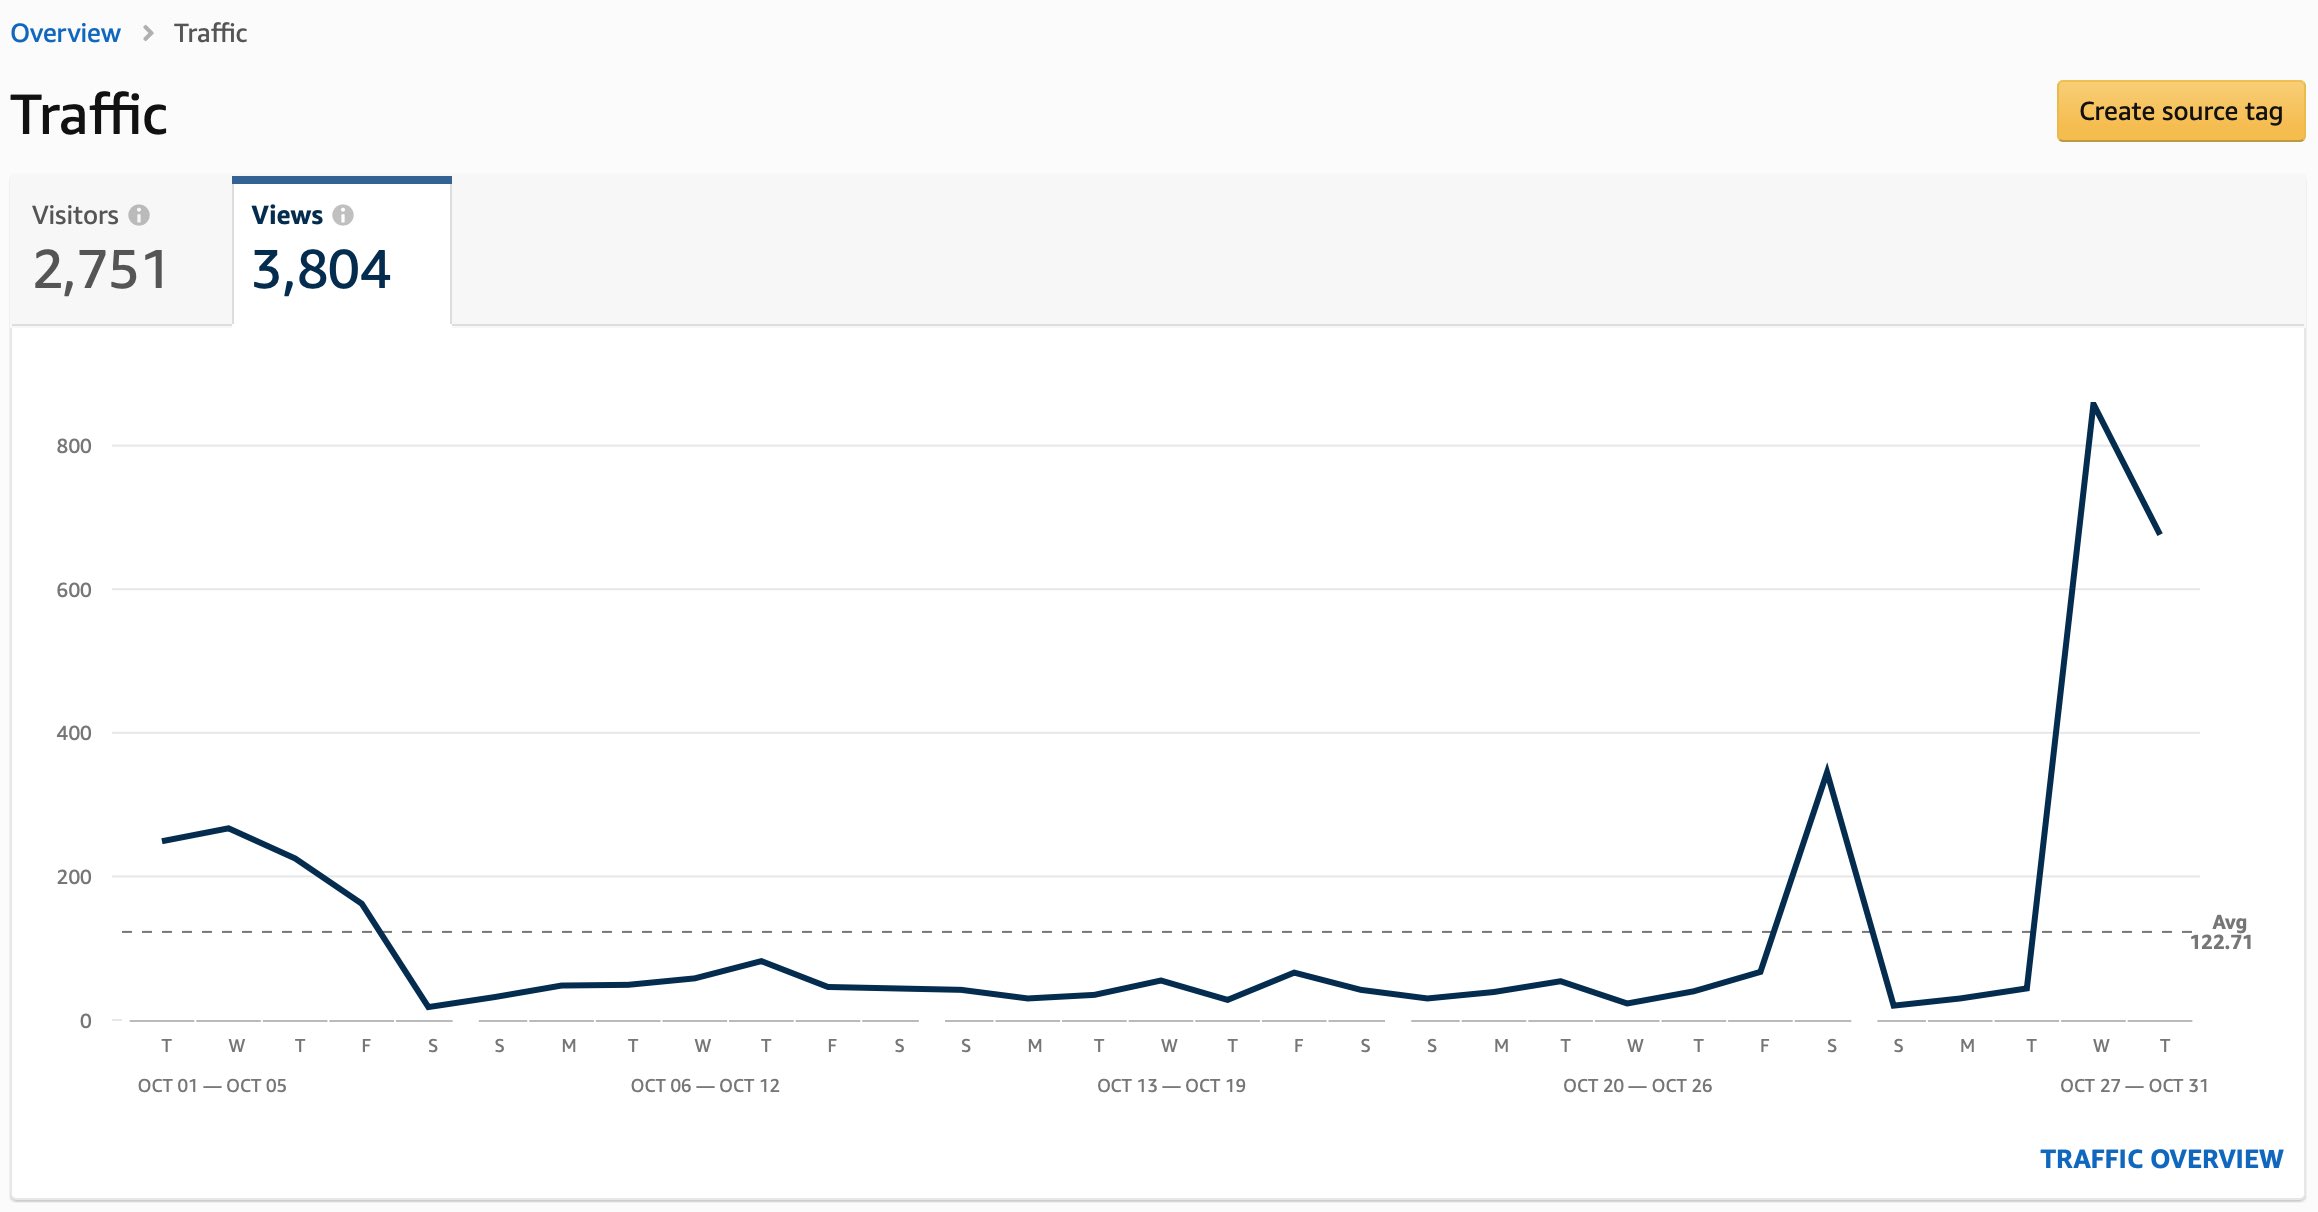
You can read views from the dashboard by understanding how they are improving day by day.
Sales
With the help of sales reporting view, you can understand the total revenue generated, total units sold, total orders, sales per visitor and units per order.
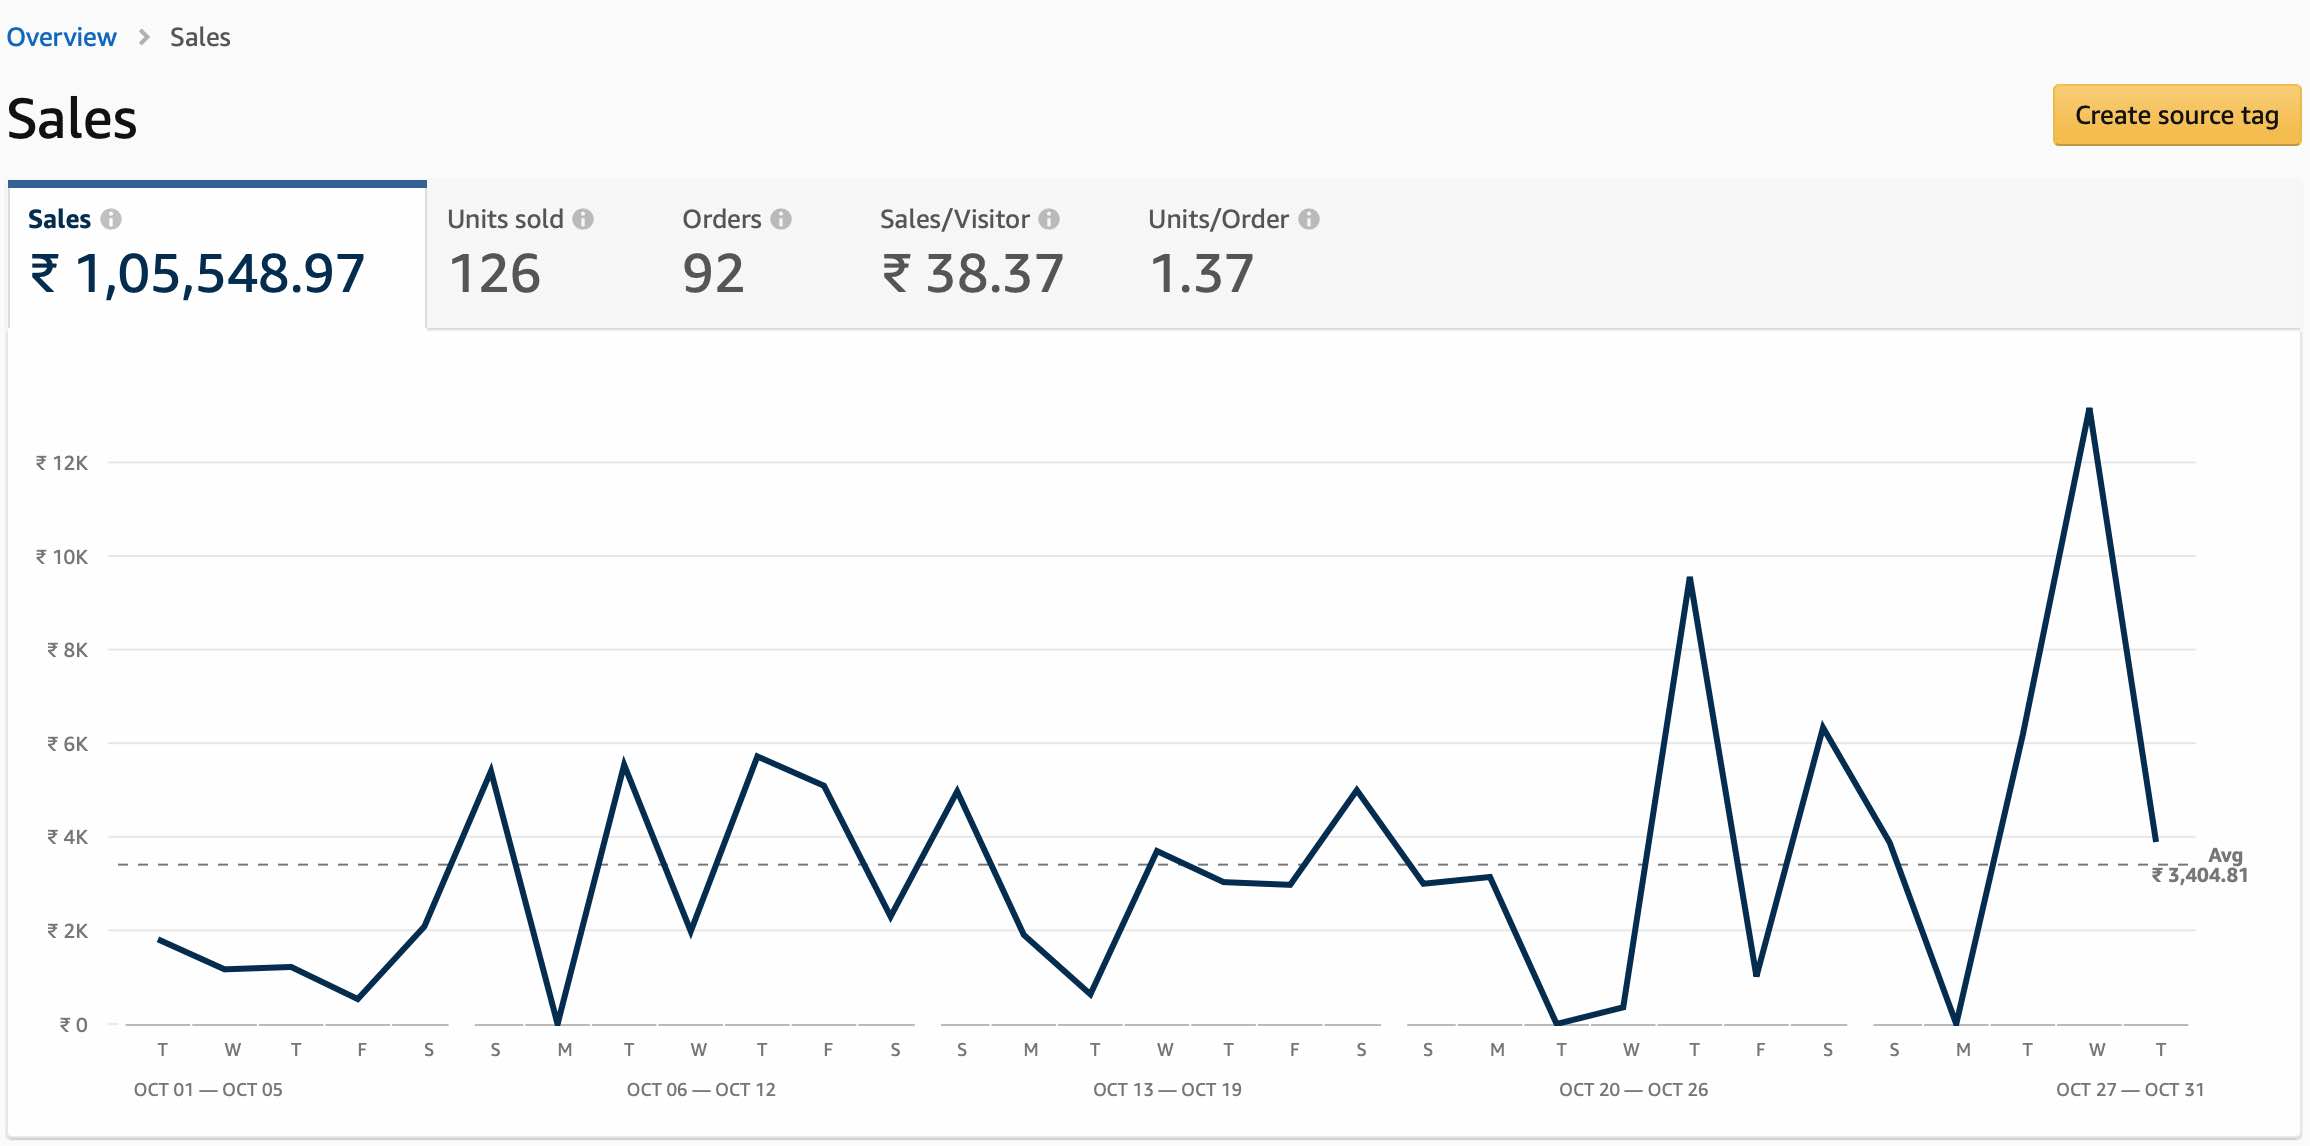
You can compare sales report month on month and see how the sales are increasing or decreasing and then optimise your store.
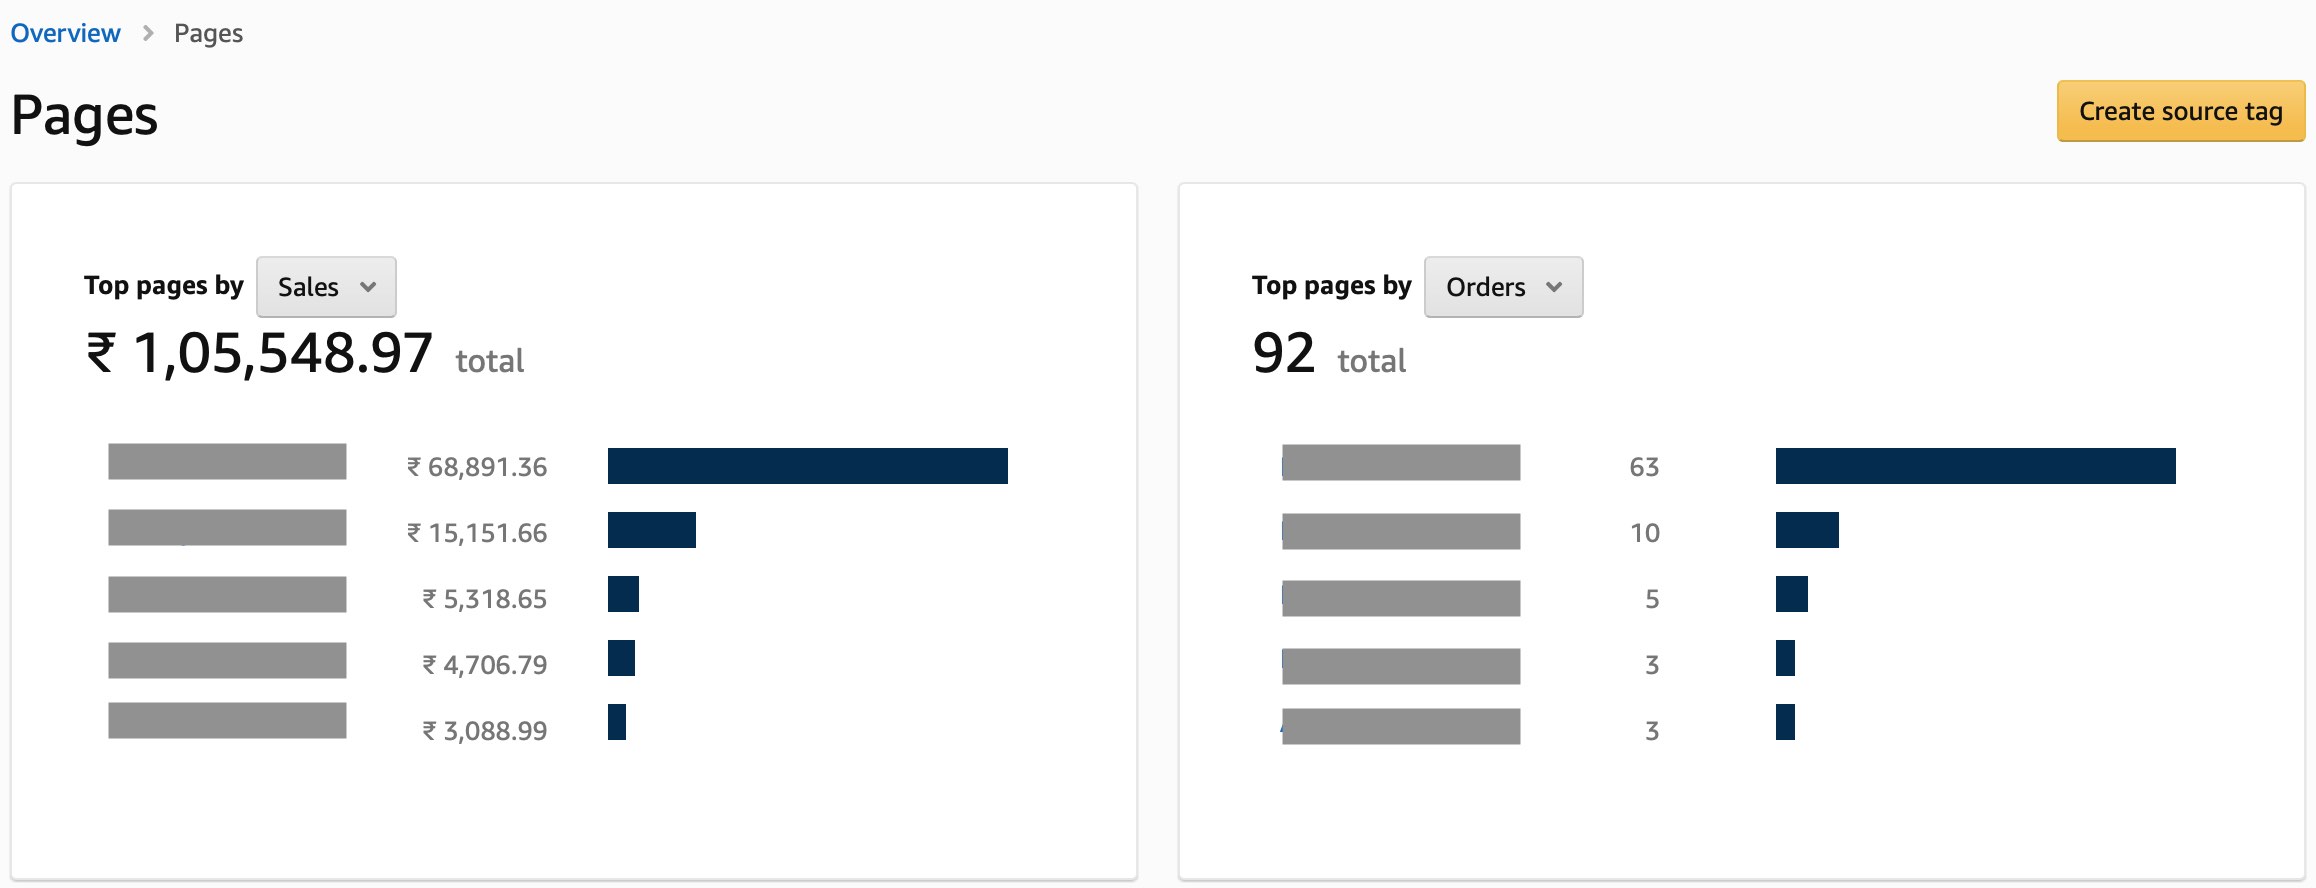
Pages
Pages report is a very important report to view, as it helps you to understand which pages are driving how much sales, how many orders, how many units, how many units per order, views etc.
Below is how the first screen on the pages dashboard looks like, you can filter data by clicking on sales or orders button as in the below screenshot.
The second screen in the pages section, helps you to understand page level data of all the pages on your store. It gives visits, views, orders, sales, sales per visit and units per order for each page on your store, which helps you to understand which page is performing better and then you can move budgets towards selected pages for advertising.
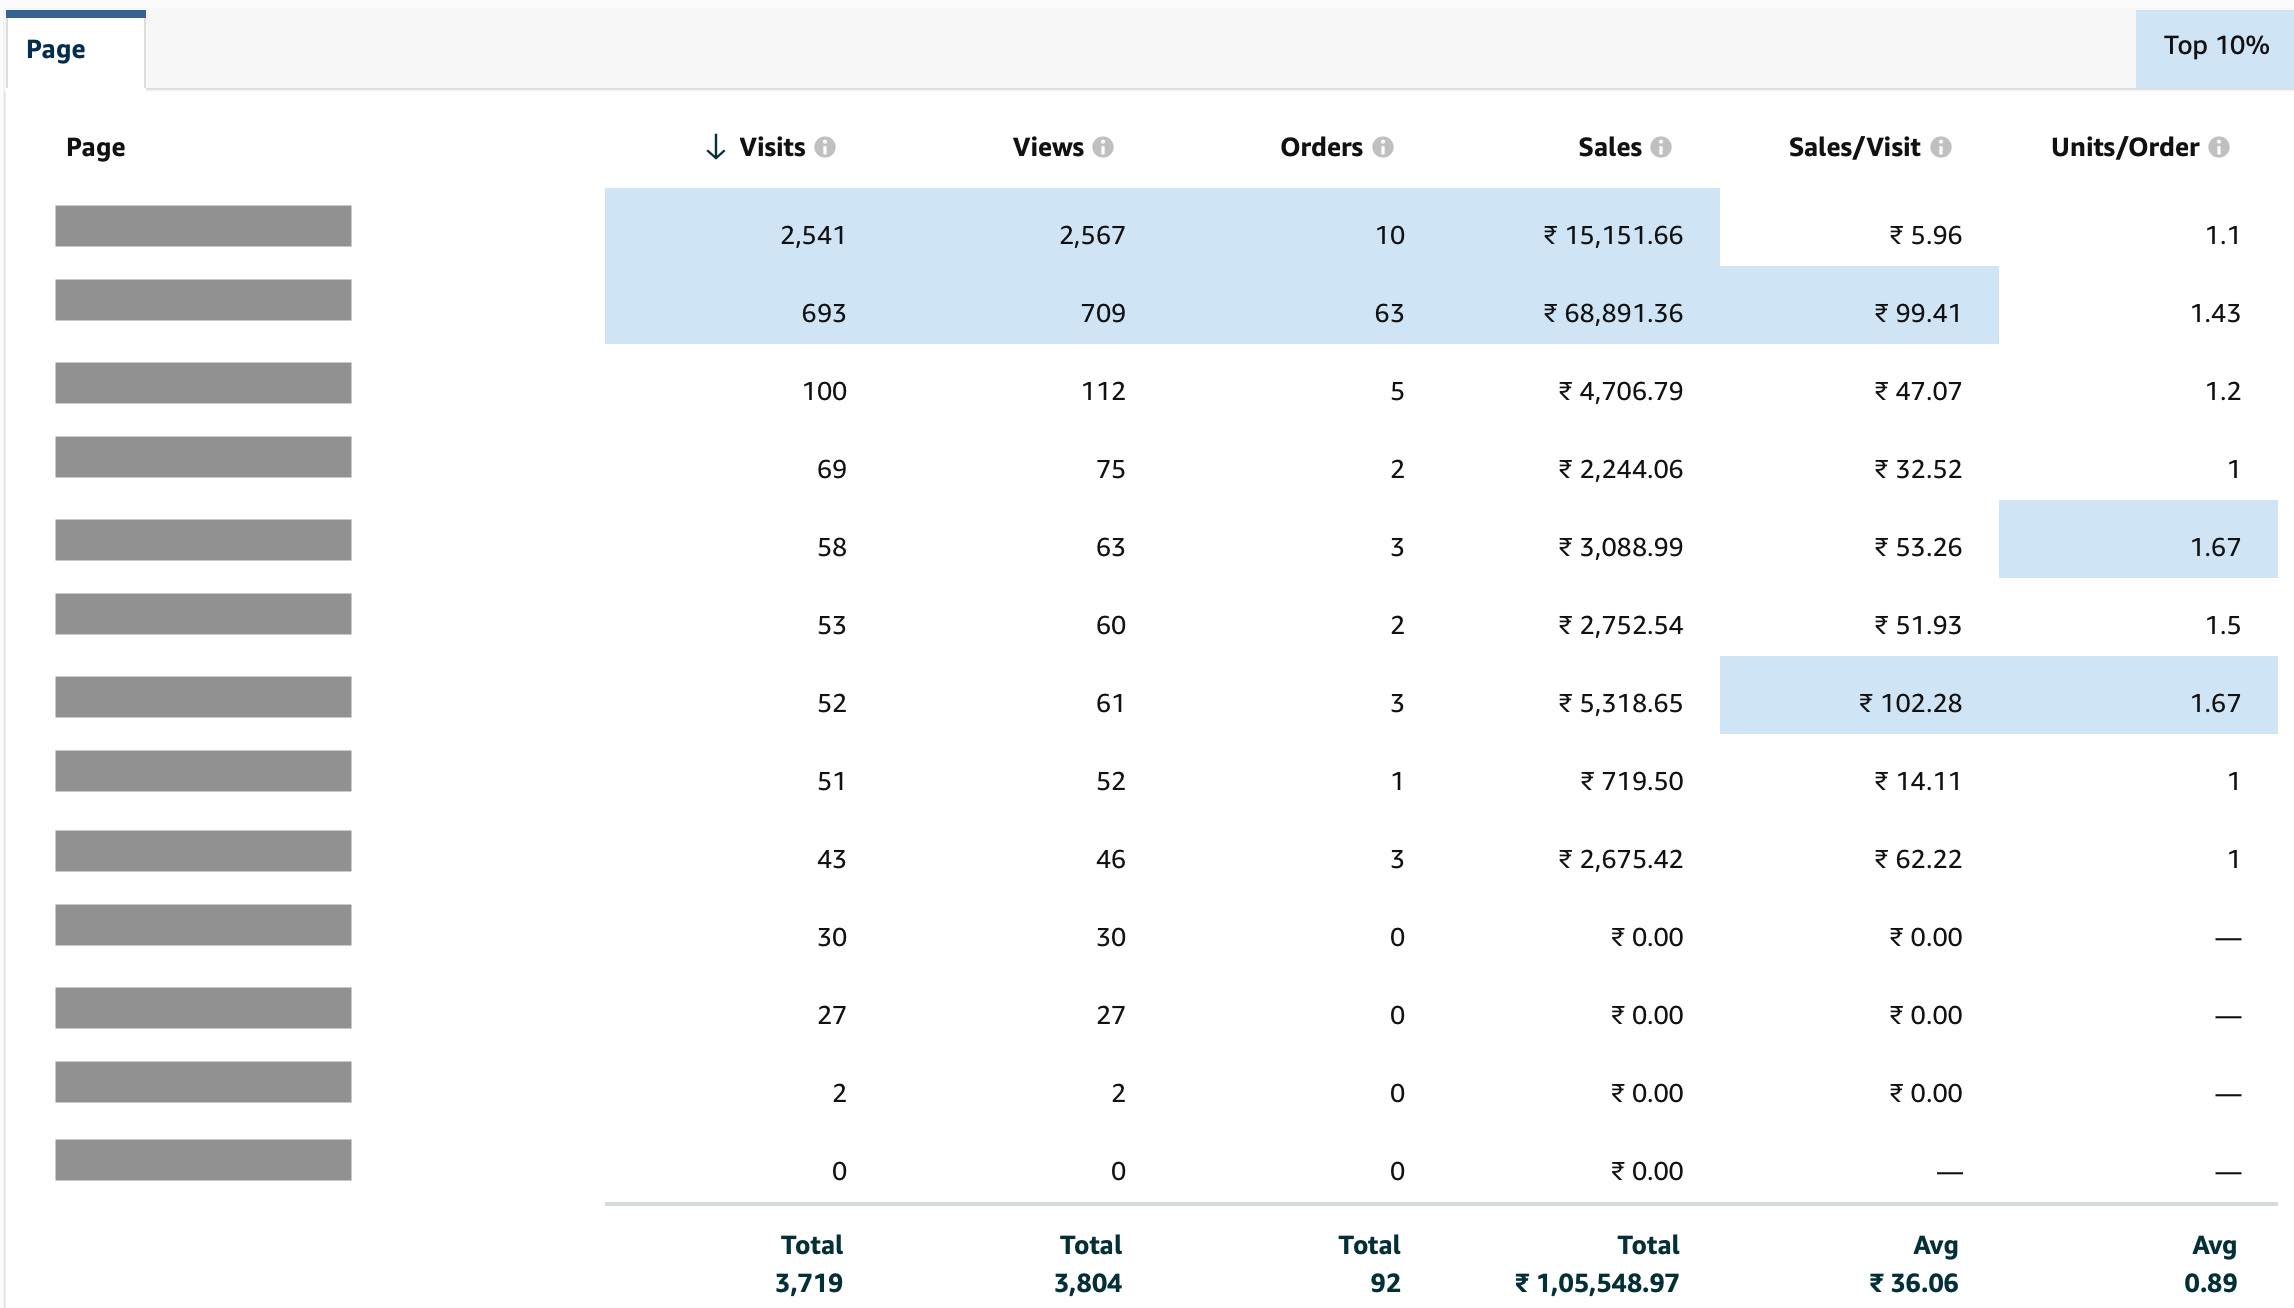
You can further deep dive at a specific page level by clicking on a particular page. For eg: I have clicked on the first page as per the above screen which has 2,541 visits, post that I can see a new page with the below screenshot which gives total views, sales, units sold and order.
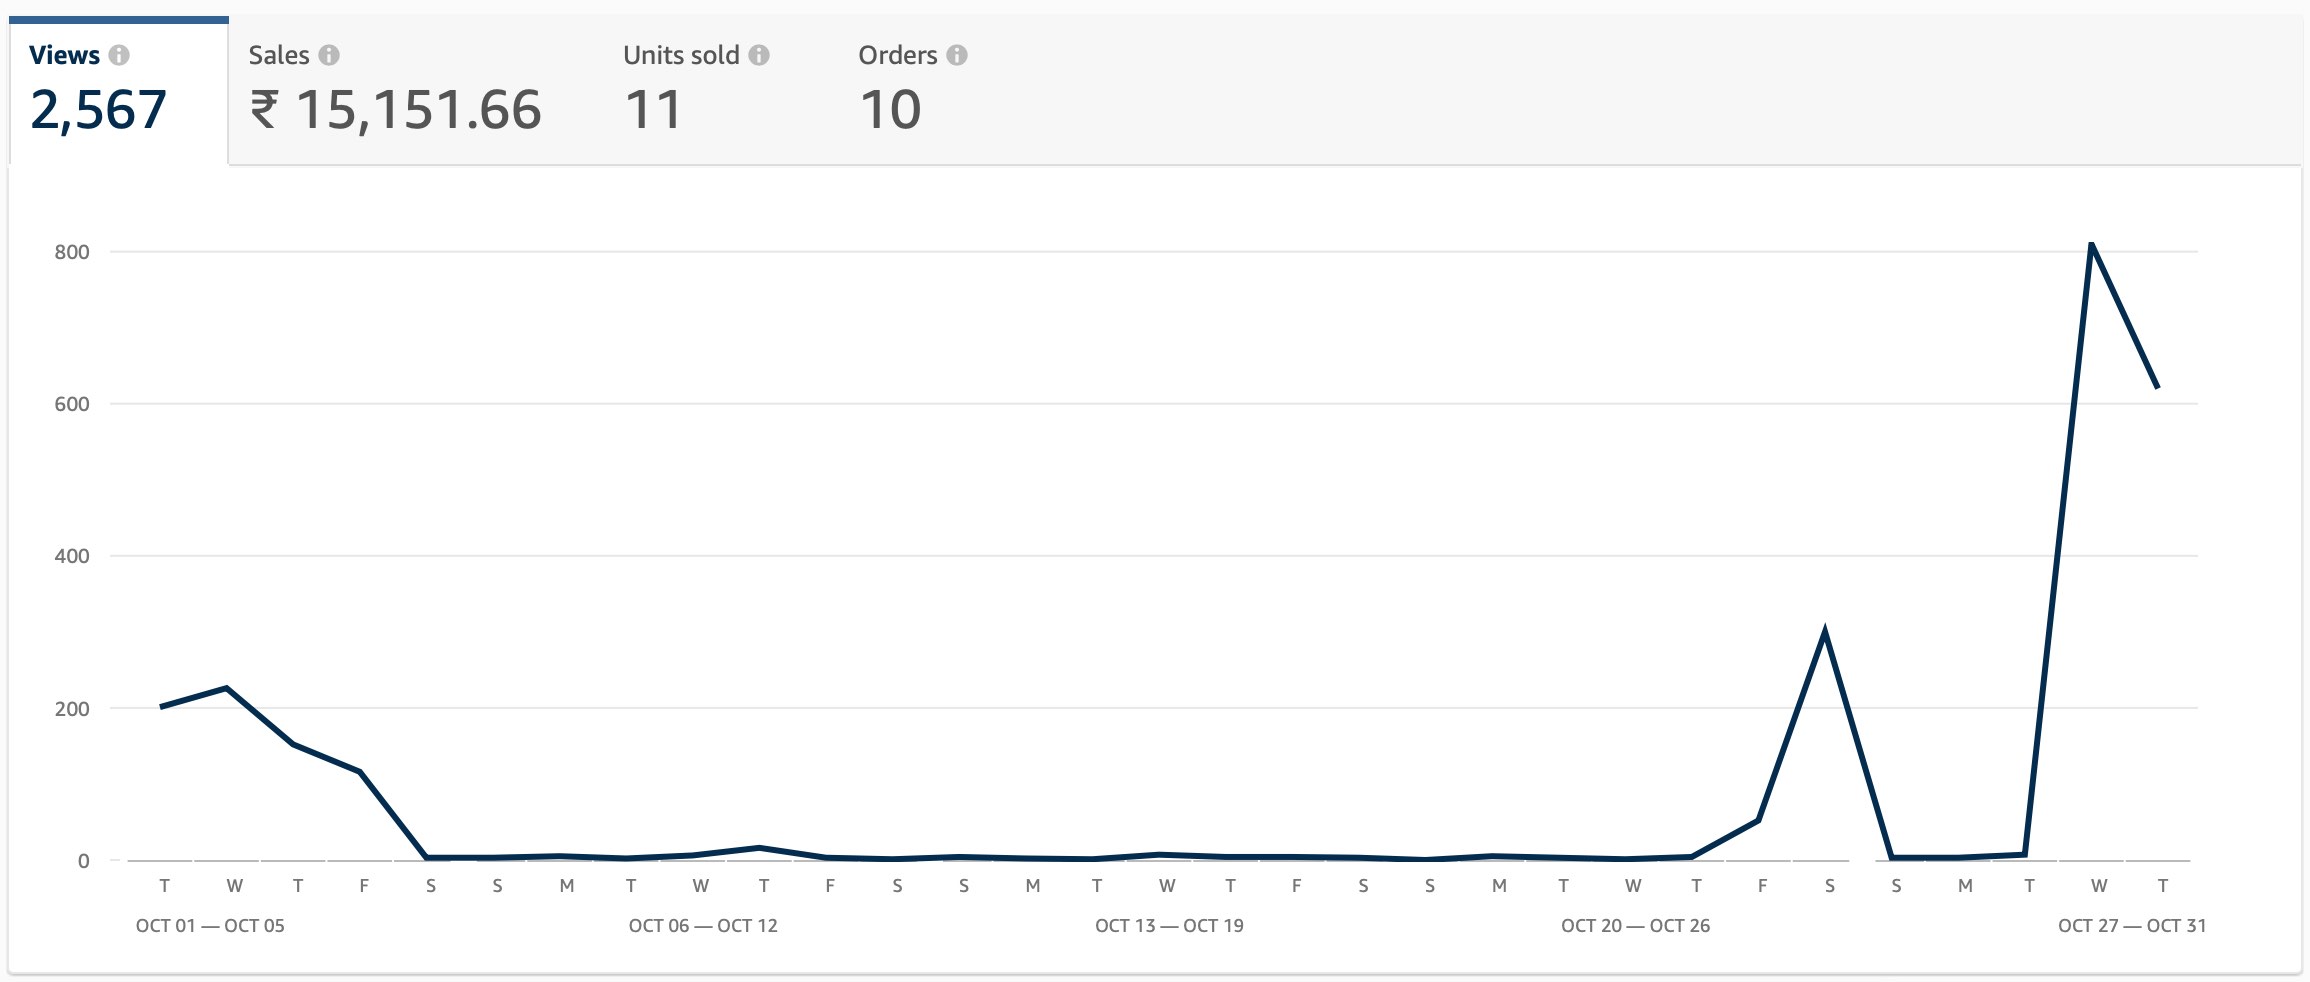
Now once I further scroll down, I can see the source level data for other sources, Amazon organic traffic and Amazon sponsored brand (Amazon paid ads) traffic as below. For each source I can further see data of visits, views, orders, sales, sales per visit and units per order.
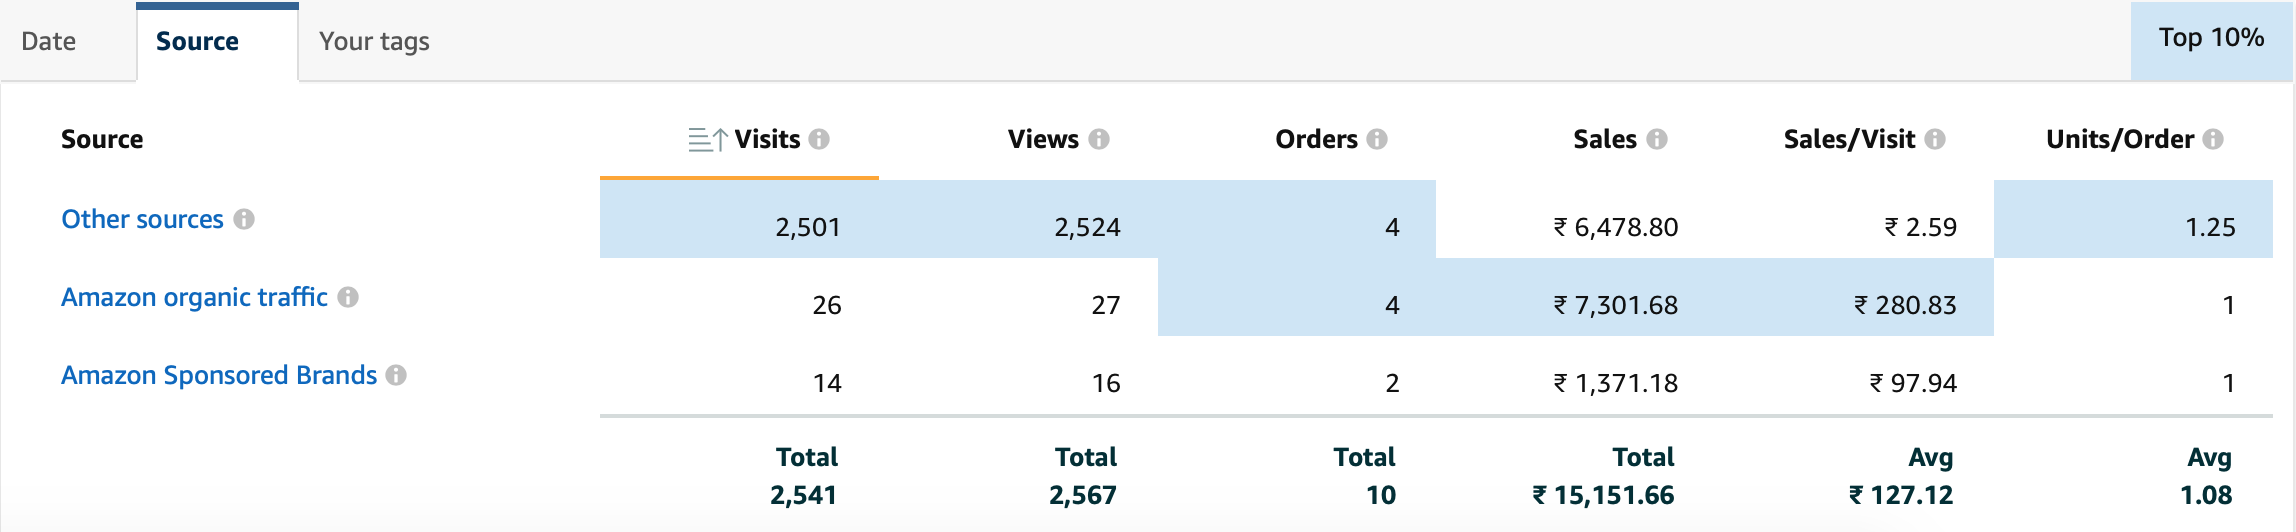
You can see the majority of the data is recorded at other sources level, which is because I am diverting traffic from Facebook ads to my Amazon store.
You can also create tags to measure Facebook traffic data or Google Ads traffic data on your Amazon store. In order to view other sources data apart from Amazon click on your tags (as per above screenshot, next to source), you will observe the tag level data of different sources apart from Amazon, refer below screen.
Note: The data will only populate if you have created tags in advance
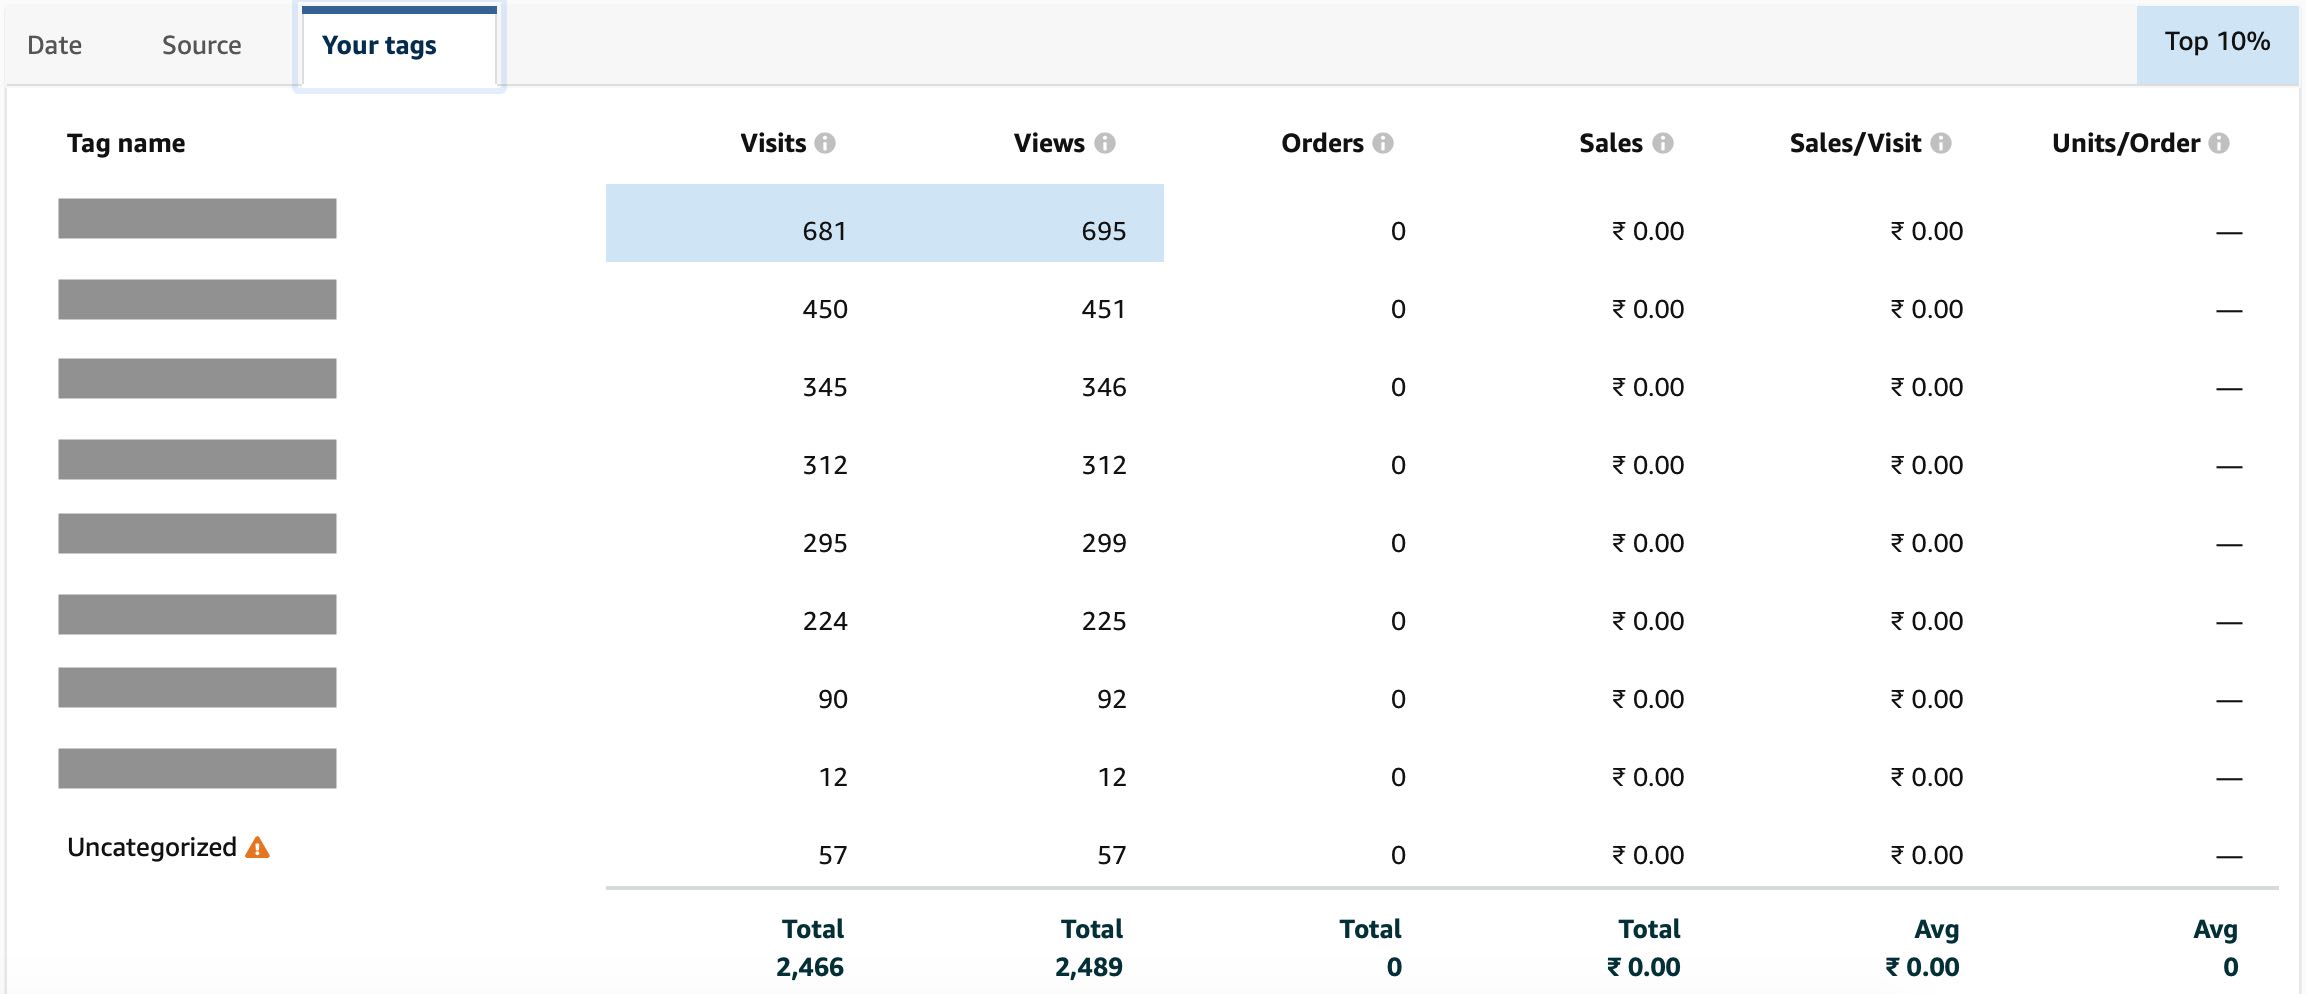
The tags report helps you to understand if campaigns outside Amazon are performing or not in terms of sales. It’s very important for you to define tags because if campaigns are not performing, then you switch budgets or optimize your campaigns.
These are the reporting options on Amazon store analytics/insights to view, monitor and then take further decisions.
Conclusion:
It’s very important to keep monitoring your Amazon store analytics data every week to learn and then optimize. The key reports which you should monitor are pages report, sales report and sources report. Keep measuring different metrics under these reports and optimize your store to improve sales. If you want to further deep dive on Amazon store analytics, you can also use Amazon Pi analytics to understand search term report, search ranking, sales by geography, share of voice and brand recall!
Master Guide to Understanding Amazon Pi Analytics
Related Articles: